
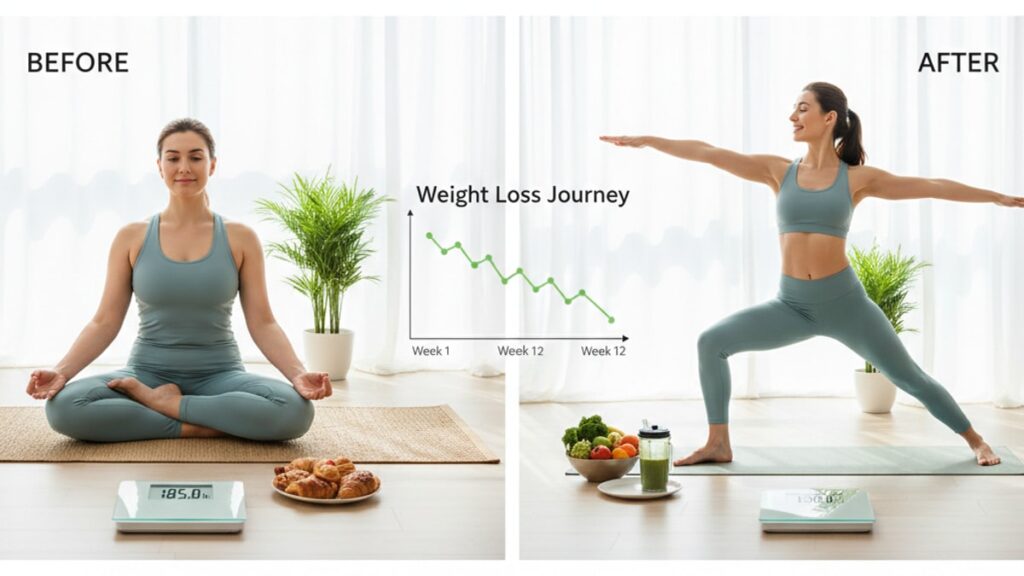
You've begun a research journey with tirzepatide, a truly remarkable peptide. The initial focus for many is, understandably, the number on the scale. It's tangible. It's simple. But here's a truth our team has seen play out time and time again in 2026: if the scale is your only guide, you're flying blind. You're missing the profound, nuanced metabolic story unfolding within the body. A story of shifting body composition, enhanced insulin sensitivity, and fundamental changes in metabolic health.
Tracking progress isn't just about validation; it's about data. It’s about understanding the full spectrum of effects to make informed adjustments and appreciate the cascade of positive changes that simple weight measurement completely overlooks. We're not just talking about weight loss. We're talking about a comprehensive metabolic reset. And to see that, you need a better dashboard with more sophisticated dials. Let's be honest, this is crucial. For serious researchers, relying on a single, often misleading metric is a catastrophic waste of potential data. We're here to change that perspective.
Beyond the Scale: Why Weight Isn't the Whole Story
We get it. The gravitational pull of the bathroom scale is strong. It gives you a number, a hard data point you can chart every morning. But that number is a notorious liar. It's a composite score of everything—fat, muscle, bone, water, last night's dinner. It has no nuance. It tells you nothing about the quality of the changes happening.
Imagine this scenario, one our team sees frequently. A research subject's weight stalls for three weeks. Panic sets in. Is it not working? Is it time to adjust the protocol? But a closer look at the real data tells a different story. Their waist measurement is down an inch. Their fasting blood glucose has dropped 10 points. They're reporting more energy during workouts. The scale hasn't budged because they've likely gained a pound of metabolically active muscle while shedding a pound of visceral fat. That's not a plateau. That's a monumental victory the scale completely failed to capture.
This is the core issue. Weight loss and fat loss are not the same thing. Tirzepatide, as a dual GIP and GLP-1 receptor agonist, works on a much deeper level than simple calorie restriction. It influences insulin sensitivity, slows gastric emptying, and helps regulate appetite signaling. These actions preferentially target adipose tissue, particularly the dangerous visceral fat packed around your organs, while helping to preserve lean muscle mass. Losing ten pounds of pure fat is a world away from losing seven pounds of fat and three pounds of muscle. The first scenario boosts your metabolism; the second one damages it.
That's the key. By focusing only on the scale, you risk misinterpreting these critical body recomposition phases as failures. As we move through 2026, the conversation has definitively shifted from 'weight loss' to 'metabolic health optimization.' You need the tools and the framework to track what really matters.
The Core Four: Essential Tracking Metrics for 2026
So, if not the scale, then what? Our experience has helped us distill the process down to four critical pillars of tracking. Combining these gives you an unflinching, high-definition picture of your progress. It's the difference between a blurry photograph and a 4K video.
1. Body Composition Analysis
This is your number one priority. Understanding the ratio of fat mass to lean mass is the most important dataset you can collect. It tells you where the weight change is coming from.
- DEXA Scan (Dual-Energy X-ray Absorptiometry): This is the undisputed gold standard. We can't stress this enough. A DEXA scan gives you an incredibly precise breakdown of your body composition, including bone mineral density, lean body mass, and fat mass. Even better, it breaks it down by region. You can see exactly how much visceral adipose tissue (VAT)—the highly inflammatory fat surrounding your organs—you're losing. This is a critical, non-negotiable element for serious data collection. A 15% reduction in VAT is a massive health win that a simple scale would never reveal.
- Bioelectrical Impedance Analysis (BIA): These are your modern smart scales. They send a tiny, imperceptible electrical current through your body to estimate body fat, muscle mass, and water content. Are they as accurate as a DEXA? No, not even close. Their readings can be thrown off by your hydration level, when you last ate, or if you just exercised. However, they are fantastic for tracking trends. If you use the same scale at the same time of day under the same conditions (e.g., first thing in the morning), you can get a very useful directional sense of your progress between more accurate scans.
- Good Old-Fashioned Measurements: Never underestimate the power of a simple tape measure. Tracking your waist, hips, chest, and thigh circumference on a weekly or bi-weekly basis provides incredible real-world data. The waist-to-hip ratio, in particular, is a strong indicator of visceral fat. Often, the tape measure will show progress long before the scale does. Photos are also powerful; a picture taken every four weeks can reveal changes you don't notice in the mirror each day.
2. Metabolic Blood Panels
This is where you see the magic happening on the inside. Tirzepatide's primary power lies in its ability to overhaul metabolic function. Regular blood work provides objective, undeniable proof of these changes. We recommend establishing a baseline before you begin and then re-testing every 3-4 months.
- HbA1c: This measures your average blood sugar over the past three months. It's the single best marker for long-term glycemic control. Seeing this number drop is a clear sign of improved insulin sensitivity.
- Fasting Glucose & Fasting Insulin: These two markers together allow you to assess insulin resistance using a HOMA-IR calculation. As your body becomes more sensitive to insulin, you'll see both of these numbers decrease. This is a foundational goal of metabolic health.
- Lipid Panel: Keep a close eye on your triglycerides, HDL ('good' cholesterol), and LDL ('bad' cholesterol). Tirzepatide often has a profoundly positive impact here, particularly in lowering triglycerides, which is a major marker for cardiovascular risk.
- Inflammatory Markers: High-sensitivity C-reactive protein (hs-CRP) is a key indicator of systemic inflammation. As visceral fat decreases and metabolic health improves, you'll typically see a significant drop in hs-CRP.
For researchers, the quality of the peptide used in studies directly impacts the reliability of these results. Inconsistent purity leads to inconsistent data. That's why at Real Peptides, we're relentless about our small-batch synthesis and exact amino-acid sequencing for compounds like our research-grade Tirzepatide. When you're tracking these sensitive biomarkers, you need to be absolutely certain that the compound is not a confounding variable.
3. Subjective Well-being and Biofeedback
Data isn't just numbers in a spreadsheet; it's also about how a subject feels and functions. This qualitative data provides context and often predicts the quantitative changes to come.
- Appetite and Cravings: How has your relationship with food changed? Are the constant, nagging cravings gone? Do you feel full and satisfied with smaller portions? This 'food noise' reduction is one of the most immediate effects people notice.
- Energy Levels: Are you experiencing more stable energy throughout the day, without the dramatic peaks and crashes that come from blood sugar instability? Many report a clean, sustained energy that feels fundamentally different.
- Sleep Quality: Improved metabolic health almost always leads to better sleep. Tracking sleep duration and perceived quality (e.g., how rested you feel upon waking) is a valuable metric.
- Mood and Mental Clarity: Brain fog is often a symptom of metabolic dysfunction. As your body becomes more efficient at regulating energy, mental clarity and mood can improve dramatically.
Keeping a simple daily journal—just a few notes on these points—can reveal powerful patterns over time. It humanizes the data and connects the dots between the lab results and real-life experience.
4. Physical Performance and Endurance
This is where the rubber meets the road. How is your body performing? Preserving lean muscle mass is great, but what does it mean in practice?
- Strength: Are you able to maintain or even increase your strength in the gym? This is a fantastic sign that you're losing fat, not precious muscle.
- Endurance: Can you walk up that hill without getting winded? Is your recovery time after a workout shorter? Tracking your capacity for physical work, whether it's a 5k time or just carrying groceries, is a tangible measure of improved health.
When you see these metrics improving alongside positive changes in your blood work and body composition, you know you're on the right path. It's a complete, 360-degree view of success.
Creating Your Tracking Protocol: A Step-by-Step Approach
Alright, theory is great, but execution is what matters. How do you actually put this all together into a coherent plan? It's simpler than it sounds. It just requires a little forethought.
First, establish your baseline. We mean this sincerely: do not start any protocol without getting comprehensive baseline data first. This means getting your blood work done, getting a DEXA scan if possible, and taking all your measurements and photos. This is your 'Day 0' snapshot, the reference against which all future progress will be measured.
Next, set a cadence for your tracking. Trying to measure everything every day will lead to burnout and data overload. You need a sustainable rhythm.
- Daily (Optional): Weight (for trend data only, don't obsess).
- Weekly: Body measurements (waist, hips, etc.), progress photos, and journaling about subjective feelings (energy, appetite, sleep).
- Monthly: Use a BIA smart scale to check in on body composition trends.
- Every 3-4 Months: This is the time for the big ones—repeat your blood panels and, if possible, get another DEXA scan. This is where you'll see the most significant and scientifically valid changes.
Here’s a simple comparison of the main body composition methods to help you decide what's right for your research needs:
| Feature | DEXA Scan | Bioelectrical Impedance (BIA) | Tape Measure & Calipers |
|---|---|---|---|
| Primary Measurement | Bone density, fat mass, lean mass (regional) | Total body water, estimates fat/lean mass | Circumference, skinfold thickness |
| Accuracy | Gold Standard (Very High) | Moderate (Varies by device & hydration) | Low to Moderate (Highly user-dependent) |
| Data Provided | Detailed breakdown by body part, visceral fat | Body fat %, muscle mass %, BMI, water % | Waist-to-hip ratio, estimated body fat % |
| Cost | High ($100-$200+ per scan) | Low to Moderate (Consumer scales) | Very Low (Inexpensive tools) |
| Accessibility | Requires a clinical or specialized facility | Widely available in smart scales & gyms | Extremely accessible, can be done anywhere |
| Our Recommendation | The definitive choice for serious research. | Great for tracking trends between DEXAs. | Useful for weekly check-ins on progress. |
This multi-layered approach ensures you always have a fresh data point to look at. It prevents the frustration that comes from focusing on one slow-moving metric. When you have the right data, you can make informed decisions. We help researchers get that foundational piece right. Find the Right Peptide Tools for Your Lab and build your study on a solid foundation.
Navigating Plateaus and Interpreting Your Data
Sooner or later, it happens. A metric stalls. The key is not to panic, but to investigate. This is where having a comprehensive dataset becomes your greatest asset.
If the scale stops moving, look at your measurements. Are they still trending down? Look at your last blood panel. Is your HbA1c still improving? How about your energy levels and performance? More often than not, a 'plateau' in one area is accompanied by progress in another. This is the nature of non-linear biological change.
Our team's advice is to always look at the constellation of data, not a single star. Triangulate your findings. If your weight is stable but your waist is shrinking, you're likely undergoing body recomposition. If your fat loss slows but your fasting insulin continues to drop, your body is still making profound health improvements at a cellular level. Celebrate those wins. They are arguably more important for long-term health than the number on the scale.
This is also the time to review your lifestyle protocols. Are you consuming enough protein to support muscle preservation? Is your resistance training consistent? Are you managing stress effectively? The data from your tracking can help you pinpoint which inputs need adjustment.
The Role of Purity in Research Outcomes
Let’s talk about the elephant in the lab. None of this meticulous tracking means anything if the compound you're researching is compromised. You can have the most sophisticated tracking protocol in the world, but if your peptide is underdosed, unstable, or full of impurities, your data will be garbage. It's that simple.
Inconsistent results, unexpected side effects, and stalled progress can often be traced back to a low-quality source compound. It introduces a massive, uncontrolled variable into your research, rendering your carefully collected data unreliable. That's why we're so unapologetically obsessed with quality at Real Peptides. Our commitment to high-purity, research-grade peptides is the bedrock of our company.
Every batch is synthesized with precision, ensuring exact amino-acid sequencing and stability. This guarantees that when you're studying a compound like Tirzepatide, or any other peptide from our catalog like Retatrutide or the regenerative powerhouse BPC 157 Peptide, you are getting exactly what you ordered. This consistency is non-negotiable for producing replicable, high-integrity research. Your data is only as good as the tools you use to generate it. We encourage you to Explore High-Purity Research Peptides and see the difference that a commitment to quality makes.
Tracking your tirzepatide progress is an empowering process. It's a shift from passively hoping for change to actively documenting a profound transformation. By moving beyond the scale and embracing a holistic view of metabolic health—body composition, blood markers, subjective feelings, and performance—you gain a true understanding of the journey. It’s a more nuanced, more accurate, and ultimately, a far more rewarding way to measure success. It’s time to start tracking what truly matters. Discover Premium Peptides for Research and equip your lab with the quality it deserves.
Frequently Asked Questions
How often should I get bloodwork done when researching tirzepatide?
▼
We recommend establishing a complete baseline panel before starting. For ongoing tracking, re-testing key metabolic markers like HbA1c, fasting insulin, and lipids every 3 to 4 months provides an excellent view of metabolic changes without being excessive.
Is a smart scale accurate enough for tracking body fat?
▼
While not as accurate as a DEXA scan, a bioimpedance (BIA) smart scale is a very useful tool for tracking trends. The key is consistency: weigh yourself at the same time, under the same conditions, to monitor the directional progress of your body composition between more accurate clinical tests.
What should I do if my weight goes up?
▼
Don’t panic. Short-term weight fluctuations are normal due to water retention, muscle gain, or digestion. Instead of focusing on the single data point, look at your other metrics like body measurements and how your clothes fit. If those are improving, you’re still on the right track.
Why is visceral fat so important to track?
▼
Visceral fat is the metabolically active, inflammatory fat surrounding your internal organs. It’s a major risk factor for many chronic diseases. Tracking its reduction, best done with a DEXA scan, is one of the most important indicators of improved metabolic health.
Can I track progress effectively without expensive scans?
▼
Absolutely. While DEXA scans are the gold standard, a combination of a simple tape measure, progress photos, and tracking your physical performance can provide a surprisingly accurate picture. These real-world metrics often tell a more compelling story than the scale alone.
What are some of the first signs that tirzepatide is working?
▼
Often, the very first signs are subjective. Many researchers note a significant reduction in ‘food noise’ or cravings, and an increased feeling of satiety with smaller meals. These changes in appetite signaling can occur well before major shifts on the scale.
How long does it typically take to see changes in blood work?
▼
Significant changes in markers like fasting glucose and triglycerides can often be seen within the first 1-2 months. More stable markers like HbA1c, which reflects a 3-month average, will naturally take longer to show significant improvement.
Does tirzepatide affect muscle mass?
▼
One of the key benefits of GLP-1 agonists like tirzepatide is their tendency to preserve lean muscle mass during fat loss, especially when paired with adequate protein intake and resistance training. This is a primary reason why tracking body composition, not just weight, is so critical.
Are progress photos a good way to track progress?
▼
Yes, they are an excellent tool. The body can change in ways that measurements and weight don’t fully capture. Taking photos from the front, side, and back in the same lighting every 4 weeks can reveal dramatic visual changes that provide powerful motivation.
What’s more important to track: waist measurement or overall weight?
▼
For assessing health risk and progress, our team believes the waist measurement is far more important. A shrinking waistline is a strong indicator of visceral fat loss, which directly correlates with improved metabolic health, regardless of what the scale says.
How do I track changes in insulin sensitivity specifically?
▼
The best way is through blood work. Tracking your fasting glucose and fasting insulin allows for a HOMA-IR calculation, which is a validated model for assessing insulin resistance. A decreasing HOMA-IR score over time is a direct indicator of improving insulin sensitivity.