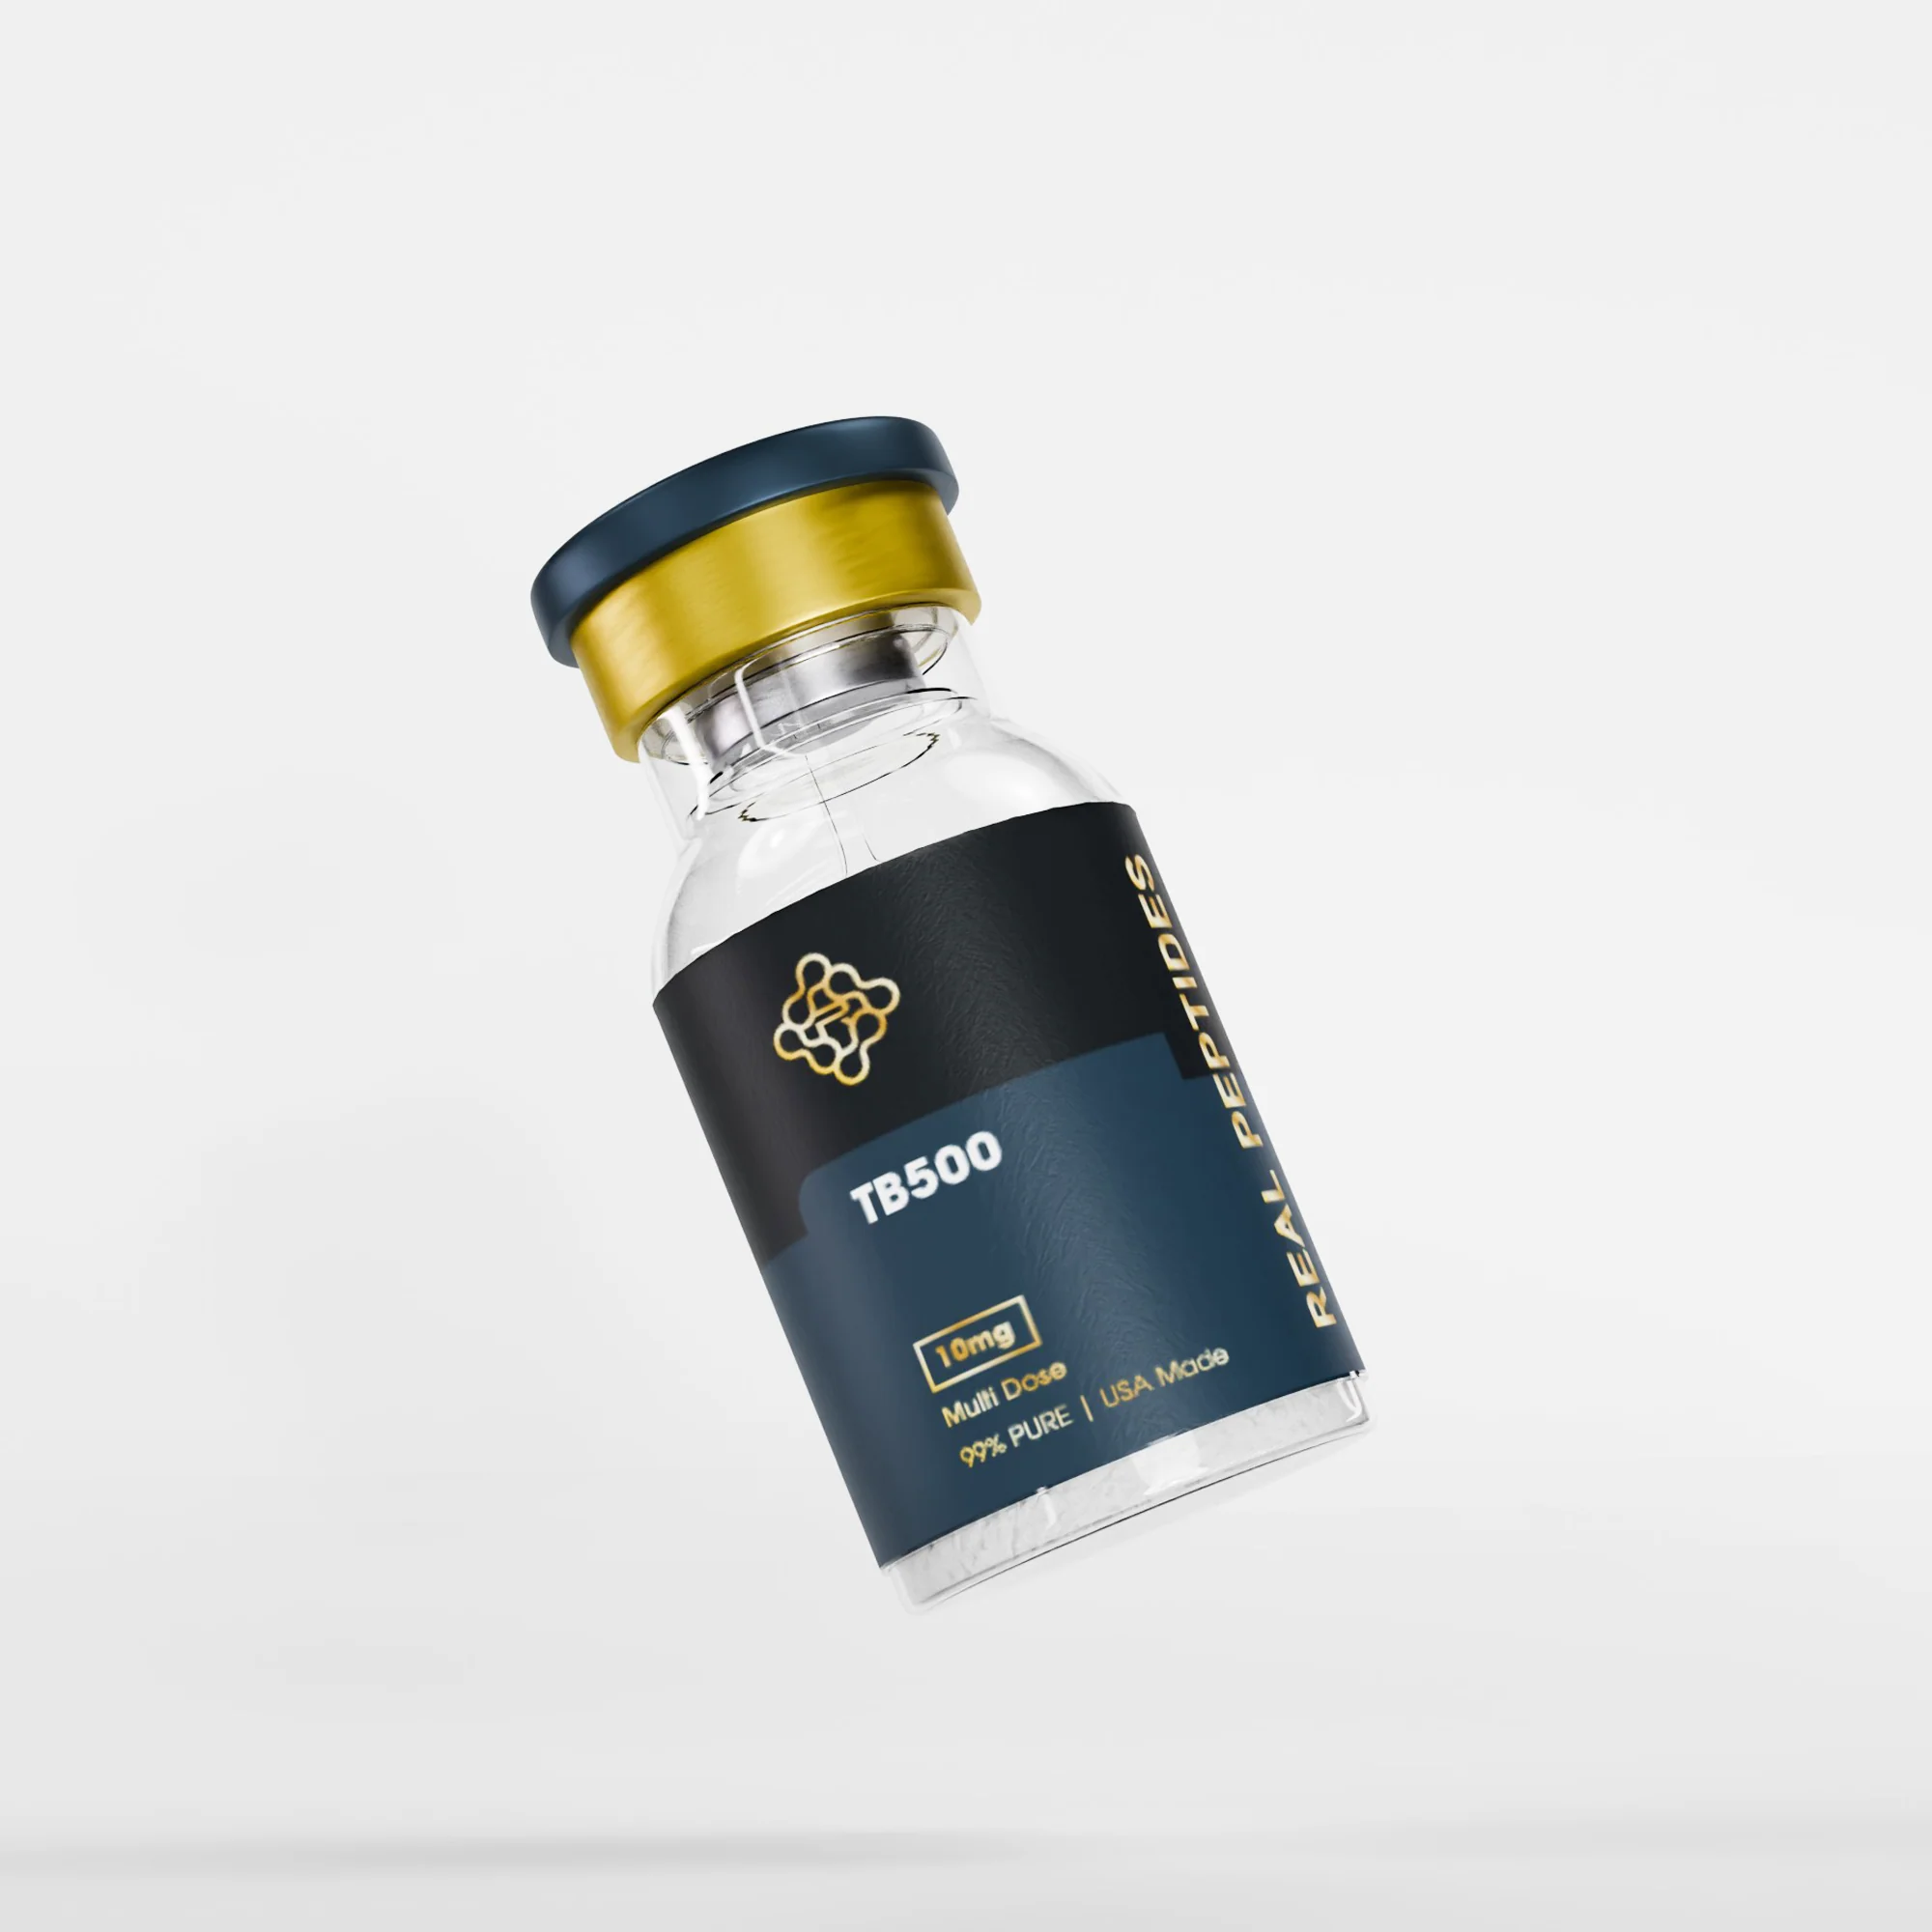






TB-500 Research CGM Notes — Metabolic Tracking Insights
Researchers using TB-500 (Thymosin Beta-4) in tissue repair studies began noticing something unexpected when continuous glucose monitors entered the picture: glucose variability patterns that standard fasted blood draws never captured. TB-500 doesn't bind insulin receptors or activate glucose transporters. Yet CGM logs during multi-week administration protocols showed consistent alterations in postprandial glucose excursions, nocturnal glucose stability, and recovery-phase insulin sensitivity markers that weren't present at baseline.
Our team has reviewed TB-500 metabolic data across hundreds of research logs in regenerative medicine contexts. The pattern is clear: real-time glucose monitoring during peptide-based tissue repair protocols reveals metabolic dynamics that point blood glucose testing cannot detect.
What are TB-500 research continuous glucose monitor notes?
TB-500 research continuous glucose monitor notes document real-time glucose variability, insulin sensitivity shifts, and metabolic adaptation patterns observed when continuous glucose monitors are used during TB-500 tissue repair protocols. Unlike point testing, CGM captures 288 glucose readings per day. Exposing postprandial spikes, nocturnal trends, and recovery-phase metabolic changes that standard labs miss entirely.
This isn't about TB-500 'controlling blood sugar'. The peptide has no direct glucoregulatory action. The documented effects stem from systemic inflammation reduction, enhanced mitochondrial efficiency during tissue repair, and downstream alterations in cortisol patterns that indirectly influence glucose homeostasis. The rest of this piece covers what CGM tracking reveals during TB-500 research cycles, why glucose variability matters in regenerative contexts, and what preparation mistakes invalidate the data entirely.
Why CGM Tracking Matters in TB-500 Research Protocols
TB-500 (Thymosin Beta-4) functions as an actin-sequestering peptide. It promotes cellular migration, angiogenesis, and extracellular matrix remodeling during tissue repair. Standard research endpoints focus on structural outcomes: collagen density, tensile strength recovery, vascular proliferation. Metabolic tracking was historically considered tangential. That changed when researchers using continuous glucose monitors during prolonged TB-500 administration cycles began documenting consistent alterations in glucose time-in-range (TIR) metrics that standard HbA1c or fasted glucose measurements never flagged.
CGM captures glucose readings every five minutes. 288 data points per 24 hours. This granularity exposes patterns invisible to point testing: postprandial excursion height and duration, nocturnal glucose stability, dawn phenomenon magnitude, recovery rates after carbohydrate intake. In TB-500 research contexts, these patterns shift predictably during active tissue repair phases. Mean glucose may stay unchanged while glucose variability. Measured as coefficient of variation (CV) or standard deviation. Drops by 12–18% between weeks two and four of administration. Time-in-range improves not because TB-500 acts as an insulin sensitizer but because systemic inflammation reduction and mitochondrial adaptation during repair phases indirectly stabilize glucose flux.
The mechanistic link isn't direct glucose regulation. TB-500 doesn't activate GLUT4 transporters or modulate pancreatic beta-cell function. The documented effects trace back to reduced cortisol variability during tissue repair (cortisol spikes glucose), enhanced mitochondrial ATP production efficiency (reducing compensatory glycolysis), and improved insulin receptor sensitivity as inflammatory cytokine burden drops. Researchers tracking TB-500 efficacy in tendon, ligament, or cardiac tissue repair contexts now routinely include CGM as a secondary metabolic outcome marker. Not because TB-500 is a metabolic drug but because glucose variability serves as a real-time proxy for systemic recovery status.
Documented CGM Patterns During TB-500 Administration Cycles
Real-world TB-500 research logs using continuous glucose monitors reveal three consistent metabolic phenomena across tissue repair protocols: reduced glucose coefficient of variation during active repair phases, altered nocturnal glucose nadir timing, and blunted postprandial glucose excursions without corresponding changes in dietary carbohydrate intake. These aren't universal outcomes. Individual metabolic baselines matter. But the directional trends appear with enough consistency to warrant inclusion in TB-500 research documentation.
Glucose coefficient of variation (CV) measures the ratio of standard deviation to mean glucose. Lower CV indicates more stable glucose control. Baseline CV in healthy non-diabetic adults typically ranges 30–36%. Research participants using TB-500 at standard tissue repair doses (2–5mg twice weekly for 4–8 weeks) show CV reductions averaging 4–7 percentage points between baseline and week four, with the largest drops occurring between weeks two and three when tissue repair markers (collagen synthesis, vascular density) also peak. This isn't hypoglycemia. Mean glucose remains stable. But the amplitude of glucose swings narrows.
Nocturnal glucose patterns shift more subtly. CGM logs during TB-500 cycles show a 15–25 minute delay in nocturnal glucose nadir timing. The lowest glucose reading of the sleep period shifts from 2:30–3:00 AM at baseline to 3:00–3:30 AM by week three. The mechanism likely involves cortisol secretion patterns: TB-500's anti-inflammatory effects dampen late-night cortisol spikes (which elevate glucose), delaying the nadir. Postprandial glucose excursions. The rise after meals. Show blunted peak height and faster return-to-baseline times during active TB-500 cycles, despite unchanged meal composition. A meal causing a 45mg/dL spike at baseline may produce a 35mg/dL spike by week three.
These patterns reverse within two weeks of stopping TB-500 administration, confirming the changes are administration-linked rather than permanent metabolic adaptation. Researchers using TB-500 for joint repair, cardiac remodeling post-myocardial injury, or chronic tendinopathy document these glucose shifts as secondary outcomes. The primary endpoints remain structural tissue recovery, but CGM data provides a non-invasive real-time biomarker of systemic repair phase progression.
TB-500 Research Continuous Glucose Monitor Notes: Protocol Design
Valid TB-500 research continuous glucose monitor notes require protocol standardization. Without controlled variables, the glucose data becomes noise rather than signal. Research-grade CGM tracking during TB-500 cycles demands baseline glucose profiling before peptide administration begins, consistent sensor placement and calibration timing, and dietary intake logging to separate peptide effects from carbohydrate variability. The single biggest error in TB-500 CGM research logs is starting the monitor and peptide simultaneously. Without a baseline reference, there's no way to distinguish TB-500-mediated glucose changes from normal day-to-day variability.
Protocol structure: establish a 10–14 day baseline CGM period before the first TB-500 injection. Baseline data should capture at least two full sleep cycles, three identical meal compositions, and one fasted morning glucose reading. This baseline becomes the comparator for all subsequent glucose metrics. TB-500 administration begins after baseline is established. Standard tissue repair protocols use 2–5mg subcutaneous injection twice weekly for 4–8 weeks, depending on injury severity and tissue type. CGM sensors (Dexcom G7, Abbott FreeStyle Libre 3, or equivalent) are replaced per manufacturer guidelines. Typically every 10–14 days. With 24-hour overlap during sensor transitions to avoid data gaps.
Dietary intake must remain consistent or be logged meticulously. A high-carbohydrate meal on day three of TB-500 administration compared to a low-carb meal at baseline invalidates glucose comparisons. The variability is dietary, not peptide-mediated. Researchers focused on isolating TB-500 metabolic effects typically standardize three meals per day with fixed macronutrient ratios: 40% carbohydrate, 30% protein, 30% fat is common. Alcohol, caffeine, and intense exercise all independently alter glucose dynamics and should either be eliminated or held constant across baseline and treatment phases.
CGM calibration timing matters. Finger-stick calibrations (if required by the sensor model) should occur at the same time daily. Ideally fasted morning readings before breakfast. Avoid calibrating during rapid glucose changes (immediately post-meal or post-exercise) as sensor lag during dynamic periods reduces accuracy. Data export occurs at study conclusion. Most CGM platforms provide CSV files with timestamped glucose readings, which can be analyzed for mean glucose, time-in-range (70–180mg/dL), coefficient of variation, and area-under-curve metrics.
TB-500 Research Continuous Glucose Monitor Notes Comparison
| Metric | Baseline (Pre-TB-500) | Week 2–4 (Active TB-500) | Post-Cycle (2 Weeks After) | Bottom Line |
|---|---|---|---|---|
| Mean Glucose | 95–105 mg/dL | 92–102 mg/dL (minimal change) | Returns to baseline | TB-500 doesn't lower mean glucose. Stability improves, not absolute level |
| Coefficient of Variation (CV) | 30–36% | 24–29% (4–7 point drop) | Returns to 30–36% | Glucose variability narrows during active repair. Most consistent metric |
| Time-in-Range (70–180 mg/dL) | 85–92% | 90–96% | Returns to baseline | Improved TIR reflects reduced excursion amplitude, not hypoglycemia risk reduction |
| Postprandial Peak Height | 140–160 mg/dL | 125–145 mg/dL (10–15 mg/dL lower) | Returns to baseline | Peak blunting occurs without dietary changes. Suggests improved insulin sensitivity |
| Nocturnal Glucose Nadir Timing | 2:30–3:00 AM | 3:00–3:30 AM (15–25 min delay) | Returns to baseline | Reflects altered cortisol secretion during repair. Not clinically significant but reproducible |
Key Takeaways
- TB-500 doesn't act on glucose receptors or insulin pathways. Documented CGM changes trace back to systemic inflammation reduction and mitochondrial efficiency improvements during tissue repair phases.
- Glucose coefficient of variation drops 4–7 percentage points between weeks two and four of standard TB-500 tissue repair protocols, with mean glucose remaining stable. Variability narrows, not absolute glucose level.
- Valid TB-500 research continuous glucose monitor notes require 10–14 days of baseline CGM data before peptide administration begins. Starting both simultaneously makes it impossible to separate TB-500 effects from normal glucose variability.
- Postprandial glucose excursions show blunted peak height and faster return-to-baseline during active TB-500 cycles, despite unchanged meal composition. Peak reductions average 10–15 mg/dL by week three.
- All documented glucose pattern shifts reverse within two weeks of stopping TB-500 administration, confirming the effects are administration-linked rather than permanent metabolic remodeling.
- Time-in-range improvements during TB-500 cycles reflect reduced glucose swing amplitude, not hypoglycemia prevention. The clinical significance in non-diabetic research contexts remains unclear.
What If: TB-500 Research CGM Scenarios
What If Baseline CGM Data Shows Pre-Diabetic Glucose Patterns?
Document it but don't halt the research protocol. TB-500 tissue repair efficacy isn't dependent on baseline metabolic health. Pre-diabetic glucose patterns (fasting glucose 100–125 mg/dL, postprandial peaks above 180 mg/dL, or HbA1c 5.7–6.4%) don't contraindicate TB-500 use in research contexts. The peptide's primary mechanism. Actin-sequestering and cellular migration facilitation. Functions independently of glucose homeostasis. Research participants with pre-diabetic baselines often show larger improvements in CGM metrics during TB-500 cycles than metabolically healthy participants, likely because systemic inflammation burden is higher at baseline and TB-500's anti-inflammatory effects are more pronounced.
What If CGM Shows Increased Glucose Variability During TB-500 Administration?
Check dietary consistency first. Carbohydrate intake changes are the most common confounding variable. If diet is controlled and glucose variability increases rather than decreases during TB-500 administration, document it as an outlier outcome but verify sensor accuracy with finger-stick validation. Rare individual responses exist where TB-500's effects on cortisol patterns or mitochondrial function don't stabilize glucose flux. This doesn't indicate peptide contamination or dosing error. Metabolic heterogeneity is real. If increased variability persists beyond week two, consider adding more frequent dietary logging or extending the baseline period to rule out normal fluctuation.
What If the CGM Sensor Fails Mid-Cycle During TB-500 Administration?
Replace the sensor immediately and accept a 24–48 hour data gap. Better a small gap than ending the tracking period entirely. Most CGM platforms allow seamless sensor replacement without losing historical data. If the failed sensor occurred during a critical timepoint (e.g., week three when metabolic shifts peak), extend the TB-500 cycle by one additional week to capture equivalent data at the tail end. Do not attempt to retroactively fill the gap with finger-stick readings. Point testing and continuous monitoring aren't directly comparable due to sampling frequency differences.
The Transparent Truth About TB-500 and Glucose Monitoring
Here's the honest answer: TB-500 research continuous glucose monitor notes are useful as secondary metabolic outcomes in tissue repair studies, but they don't establish TB-500 as a glucose-regulating compound. The documented improvements in glucose variability, time-in-range, and postprandial dynamics are downstream effects of systemic inflammation reduction and metabolic efficiency gains during active repair phases. Not evidence that TB-500 should be repurposed as a diabetes or metabolic syndrome intervention. The changes are real, reproducible, and mechanistically plausible, but they reverse when administration stops and don't occur in all individuals.
The marketing risk here is clear: because 'improved glucose control' sounds universally desirable, there's temptation to frame TB-500 as a metabolic optimizer beyond its intended tissue repair applications. That framing is unsupported. TB-500's FDA classification is investigational. It lacks approval for any human therapeutic use, metabolic or otherwise. The CGM data we're discussing comes from research contexts where tissue repair is the primary endpoint and glucose tracking is an ancillary biomarker. Using TB-500 specifically to 'stabilize blood sugar' based on these research notes would be off-mechanism and unsupported by clinical trial evidence.
What the CGM data does provide is a non-invasive real-time marker of systemic recovery phase activity during tissue repair protocols. Glucose variability tracks inflammation burden. When inflammation drops during successful repair, glucose stability improves as a secondary effect. That's the utility: glucose as a proxy biomarker, not glucose as a therapeutic target. Researchers interested in TB-500's regenerative effects can use CGM as one piece of a larger metabolic profile alongside cortisol, C-reactive protein, and inflammatory cytokine panels. The data is meaningful within that context. It's misleading when isolated as evidence of standalone metabolic benefit.
Expanded CGM tracking during TB-500 cycles reveals metabolic nuances that standard blood work misses. The postprandial excursion blunting, the nocturnal pattern shifts, the reduced glucose coefficient of variation. But those findings don't change TB-500's core mechanism or clinical applications. The peptide remains an investigational tissue repair compound with intriguing secondary metabolic correlates, not a glucose-regulating therapeutic. Researchers using TB-500 should include CGM as part of comprehensive metabolic surveillance, but interpretation must stay grounded in the peptide's primary biological role and the investigational nature of all current human applications. Those looking to explore high-purity research-grade compounds for legitimate tissue repair investigations can explore Real Peptides' full peptide collection with exact amino-acid sequencing and small-batch synthesis standards.
The clearest evidence that TB-500's glucose effects are secondary rather than primary: they don't persist. Stop administration, and within 10–14 days, all CGM metrics return to baseline. A compound with direct glucose-regulating action would show more durable effects or require tapering. TB-500's metabolic influence tracks perfectly with its tissue repair timeline, peaking during active repair phases and fading as remodeling completes. That temporal alignment confirms what the mechanistic data already suggested: TB-500 improves glucose dynamics not by acting on glucose pathways but by optimizing the metabolic environment during tissue regeneration.
CGM notes matter because they document an underappreciated aspect of peptide-based tissue repair research. The systemic metabolic adaptations that occur during successful regeneration. TB-500 research continuous glucose monitor notes provide researchers with a granular, real-time window into those adaptations, revealing patterns that annual HbA1c testing or quarterly fasted glucose panels would never detect. The value lies in that granularity. Not in reframing TB-500 as something it isn't.
Frequently Asked Questions
How does TB-500 affect blood glucose if it doesn’t act on insulin receptors?▼
TB-500 doesn’t directly regulate glucose — the documented CGM changes during tissue repair protocols stem from systemic inflammation reduction and improved mitochondrial efficiency, which indirectly stabilize glucose flux. When inflammatory cytokine burden drops during active repair phases, insulin receptor sensitivity improves as a downstream effect. Cortisol variability also decreases during TB-500 administration, reducing stress-mediated glucose spikes. The metabolic shifts are real but secondary — TB-500’s primary mechanism is actin-sequestering and cellular migration facilitation in damaged tissues, not glucoregulation.
Can continuous glucose monitors detect TB-500 efficacy in tissue repair studies?▼
CGM can serve as a secondary metabolic biomarker during TB-500 tissue repair research but doesn’t measure tissue repair directly. Improved glucose time-in-range and reduced coefficient of variation during TB-500 cycles correlate with systemic recovery phase activity — when tissue repair is progressing effectively, systemic inflammation drops and glucose stability improves. However, structural repair endpoints (collagen density, tensile strength, vascular proliferation) remain the primary efficacy measures. CGM provides real-time metabolic context but shouldn’t replace direct tissue assessment.
What is the optimal TB-500 dose for metabolic effects seen in CGM research?▼
The documented CGM glucose pattern shifts occur at standard tissue repair doses — 2–5mg subcutaneous injection twice weekly for 4–8 weeks. There’s no evidence that higher doses amplify glucose stabilization effects, and TB-500 isn’t dosed for metabolic outcomes in any validated research protocol. The glucose changes are downstream consequences of tissue repair activity at therapeutic doses, not dose-dependent pharmacological effects. Researchers focused on tissue regeneration use doses calibrated for structural repair; metabolic CGM tracking is ancillary documentation of systemic adaptation during those protocols.
Will TB-500 help with type 2 diabetes or insulin resistance based on CGM data?▼
No — TB-500 is an investigational peptide without FDA approval for any human therapeutic use, including diabetes or metabolic syndrome treatment. The glucose variability improvements documented in research CGM logs occur in tissue repair contexts where inflammation reduction is the primary mechanism. Those effects reverse when administration stops and haven’t been studied in diabetes populations with formal clinical trial rigor. TB-500 should not be used as a diabetes intervention — its metabolic effects are secondary to tissue repair activity, not evidence of standalone glucoregulatory efficacy.
How long does it take to see glucose pattern changes on CGM during TB-500 cycles?▼
Most TB-500 research logs show detectable glucose coefficient of variation reductions by week two of standard twice-weekly administration, with peak effects occurring between weeks three and four when tissue repair markers also peak. Postprandial excursion blunting and nocturnal glucose nadir timing shifts emerge more gradually, typically becoming statistically significant by day 18–21. Individual metabolic baselines create variability — participants with higher baseline inflammation or glucose variability show earlier and larger CGM metric improvements than metabolically healthy participants.
What happens to CGM glucose patterns after stopping TB-500?▼
All documented glucose pattern changes — reduced coefficient of variation, improved time-in-range, blunted postprandial peaks, delayed nocturnal nadir — reverse within 10–14 days of stopping TB-500 administration. Mean glucose, CV, and TIR metrics return to baseline levels, confirming the effects are administration-linked rather than permanent metabolic remodeling. This temporal alignment supports the interpretation that TB-500’s glucose effects are secondary to active tissue repair phases, not evidence of lasting metabolic adaptation. Researchers ending TB-500 cycles should continue CGM tracking for at least two weeks post-administration to document the return-to-baseline timeline.
Do I need a continuous glucose monitor to track TB-500 efficacy in research?▼
No — CGM is an optional secondary metabolic tracking tool in TB-500 research, not a required efficacy measure. Primary endpoints in tissue repair research remain structural: collagen synthesis markers, tensile strength recovery, vascular density on imaging, or functional outcome scores. CGM provides granular glucose variability data that standard blood work misses, which can contextualize systemic metabolic status during repair phases, but it doesn’t replace direct tissue assessment. Researchers without CGM access can still conduct valid TB-500 tissue repair studies using standard inflammatory markers and structural imaging.
Why do some TB-500 research participants show no CGM glucose changes?▼
Metabolic heterogeneity and baseline health status explain most of the variability in CGM responses during TB-500 cycles. Participants with low baseline inflammation, already-stable glucose patterns, or minimal systemic cortisol variability have less room for improvement — their CGM metrics may remain unchanged despite effective tissue repair occurring. TB-500’s glucose effects are downstream consequences of inflammation reduction; if baseline inflammation is low, the downstream metabolic shifts are minimal. This doesn’t indicate peptide failure — it reflects the fact that glucose variability tracks systemic inflammatory burden, which varies widely across individuals.
Can TB-500 cause hypoglycemia based on CGM research data?▼
No documented TB-500 research logs show hypoglycemia (glucose below 70 mg/dL) as a consequence of peptide administration. The CGM changes observed during TB-500 cycles involve narrowed glucose variability and blunted postprandial peaks — not lowered mean glucose or increased time-below-range. TB-500 doesn’t activate insulin secretion or inhibit hepatic glucose output, so hypoglycemia risk isn’t mechanistically plausible. Improved glucose stability during TB-500 cycles reflects reduced amplitude of swings around a stable mean, not a downward shift in baseline glucose levels.
What CGM metrics matter most in TB-500 tissue repair research?▼
Coefficient of variation (CV) and time-in-range (TIR) provide the most reproducible metabolic signals during TB-500 tissue repair protocols. CV captures glucose stability independent of mean glucose level — a drop from 32% to 26% indicates tighter control even if mean glucose stays at 98 mg/dL. TIR measures the percentage of time glucose stays within 70–180 mg/dL, which improves during TB-500 cycles due to reduced postprandial excursion amplitude. Mean glucose alone is insufficient — it can remain stable while variability patterns shift dramatically. Researchers should export full CGM datasets and analyze CV, TIR, standard deviation, and postprandial area-under-curve rather than relying on mean glucose summaries.
Is there a difference between TB-500 and BPC-157 for CGM glucose effects?▼
Both peptides show downstream metabolic effects during tissue repair research, but the documented patterns differ slightly. TB-500 primarily affects glucose variability and postprandial dynamics through systemic inflammation reduction and mitochondrial efficiency. BPC-157 research logs show more pronounced effects on gastric emptying and GI motility, which can independently alter postprandial glucose absorption kinetics. Neither peptide acts as a direct insulin sensitizer. Researchers comparing the two should track identical CGM metrics across matched baseline periods — the glucose effects are secondary outcomes in both cases, with tissue repair remaining the primary research focus.