


How Long Does MOTS-c Take to Work in Research?
A 2021 study published in Cell Metabolism demonstrated that MOTS-c administration improved glucose tolerance in high-fat-diet mice within 21 days. But only when administered continuously. Single-dose studies showed transient effects that disappeared within 48 hours. The peptide doesn't work on a light-switch mechanism. It works through progressive mitochondrial adaptation that takes weeks to manifest fully.
Our team has sourced and evaluated hundreds of research-grade peptides across institutional and independent laboratories. The single most common question we field about mitochondrial-derived peptides like MOTS-c isn't dosing or reconstitution. It's timeline clarity. Researchers want to know exactly when to measure endpoints, how long to wait before declaring an intervention ineffective, and what confounds interpretation at early timepoints.
How long does MOTS-c take to work in research settings?
MOTS-c demonstrates measurable effects on cellular ATP production within 24–72 hours in isolated mitochondrial assays, but whole-organism metabolic outcomes. Insulin sensitivity, glucose disposal, exercise endurance. Require 4–8 weeks of sustained administration in animal models. The discrepancy exists because the peptide's mechanism depends on cumulative mitochondrial biogenesis and AMPK pathway upregulation, not acute receptor activation. Timeline varies by species, dose, administration route, and metabolic endpoint measured.
That timeline isn't vague hedging. It reflects genuine biological complexity. MOTS-c is a mitochondrial-derived peptide (MDP), meaning it originates from mitochondrial DNA rather than nuclear DNA. Its primary mechanism involves AMPK (AMP-activated protein kinase) activation and downstream metabolic reprogramming. Processes that unfold over days to weeks, not minutes to hours like hormone receptor agonists. This article covers the specific timeline for different experimental endpoints, the biological mechanisms driving delayed onset, and what variables accelerate or delay observable effects in controlled research settings.
MOTS-c Mechanism Drives Timeline Variability
MOTS-c doesn't bind to a surface receptor and trigger an immediate signaling cascade. It translocates to the nucleus and modulates gene transcription for metabolic enzymes. That fundamental difference explains why acute dosing studies show weak or transient effects while chronic administration protocols demonstrate robust metabolic improvement.
The peptide activates AMPK through a mechanism that remains partially uncharacterized, but downstream effects are well-documented: increased GLUT4 translocation (the glucose transporter that moves from cytoplasm to cell membrane under insulin or exercise stimulation), enhanced fatty acid oxidation in skeletal muscle, and upregulation of PGC-1α. The master regulator of mitochondrial biogenesis. None of those processes complete within hours. GLUT4 expression changes take 48–96 hours. Mitochondrial biogenesis requires 7–14 days of sustained signaling to produce measurable increases in mitochondrial density.
Research from the University of Southern California (Cohen Lab, the group that first characterized MOTS-c in 2015) demonstrated that insulin sensitivity improvements in diet-induced obese mice required 28 days of daily intraperitoneal injections at 15 mg/kg. Earlier timepoints showed trending improvements that didn't reach statistical significance. The mechanism wasn't incomplete. The biological remodeling simply hadn't finished.
Route of administration compounds timeline variability. Subcutaneous and intraperitoneal injections produce different pharmacokinetic profiles. Subcutaneous administration creates a depot effect with slower, more sustained release, while IP injection delivers faster peak plasma concentration but shorter half-life. Researchers using subcutaneous protocols consistently report delayed onset (6–8 weeks to significance) compared to IP protocols (4–6 weeks).
Cellular vs Whole-Organism Response Timelines
In vitro studies using isolated muscle cells or cultured hepatocytes show MOTS-c effects within 24–72 hours: increased oxygen consumption rate (OCR), enhanced glucose uptake, elevated ATP production. Those are direct cellular responses. Translating that to whole-organism outcomes introduces additional layers. Systemic clearance, tissue distribution, immune response, and inter-organ crosstalk.
A 2019 study in Nature Communications measured MOTS-c plasma half-life at approximately 4.2 hours in mice following IV bolus. Meaning the peptide clears rapidly and requires sustained dosing to maintain therapeutic tissue levels. Single-dose protocols produce transient metabolic shifts that resolve within 12–24 hours. Chronic dosing sustains the AMPK activation long enough for downstream transcriptional changes to accumulate.
The most dramatic timeline gap appears in exercise-related endpoints. MOTS-c has been shown to improve running endurance in aged mice. But only after 4–6 weeks of treatment. Earlier timepoints showed no endurance benefit despite measurable increases in skeletal muscle mitochondrial enzyme activity at 2 weeks. The disconnect suggests that mitochondrial enzyme upregulation is necessary but insufficient. Functional adaptation (capillary density, substrate utilization efficiency, lactate clearance capacity) requires additional time to manifest.
We've seen this pattern replicated across independent laboratories using Real Peptides' research-grade MOTS-c formulations: cellular assays show effects within days, metabolic phenotyping shows effects within weeks, and performance-based endpoints require a month or more of sustained exposure.
Research Timeline by Experimental Endpoint
Not all research questions measure the same outcome. A study evaluating acute glucose disposal uses a different timeline than one measuring mitochondrial biogenesis or lifespan extension. The table below organizes expected timelines by endpoint category based on peer-reviewed MOTS-c literature published between 2015–2026.
| Experimental Endpoint | Earliest Detectable Effect | Statistical Significance Threshold | Mechanism Driving Timeline | Professional Assessment |
|---|---|---|---|---|
| Cellular ATP production (in vitro) | 24–72 hours | 72 hours–1 week | Direct AMPK activation without systemic clearance | Useful for mechanistic proof-of-concept but doesn't predict in vivo efficacy |
| Glucose tolerance test improvement (GTT) | 1–2 weeks | 3–4 weeks | Requires GLUT4 upregulation + hepatic insulin sensitivity shift | Standard metabolic readout. Reliable and reproducible across labs |
| Insulin sensitivity (ITT or clamp) | 2–3 weeks | 4–6 weeks | Combines muscle GLUT4, adipose tissue remodeling, hepatic glucose output suppression | Gold standard for metabolic research but requires sustained dosing |
| Mitochondrial biogenesis (enzyme activity, mtDNA copy number) | 1–2 weeks | 3–4 weeks | PGC-1α transcriptional upregulation → mitochondrial replication | Slow process. PGC-1α induction takes 48–96 hours, then mitochondrial turnover takes 7–14 days |
| Exercise endurance (treadmill, rotarod) | 3–4 weeks | 4–6 weeks | Requires both mitochondrial adaptation and systemic metabolic efficiency (substrate partitioning, lactate clearance) | Functional endpoint. Most clinically relevant but slowest to emerge |
| Body composition (lean mass, fat mass) | 4–6 weeks | 6–8 weeks | Fat oxidation upregulation is gradual; requires caloric deficit or high activity to manifest | MOTS-c enhances fat oxidation capacity but doesn't override thermodynamic energy balance |
The 'Statistical Significance Threshold' column represents the minimum duration required for treatment effects to separate from control groups with p<0.05 in published studies. Not the point at which effects begin. Trending improvements often appear 1–2 weeks before significance.
Key Takeaways
- MOTS-c shows measurable cellular effects (ATP production, oxygen consumption) within 24–72 hours in isolated assays, but whole-organism metabolic improvements require 4–8 weeks of sustained administration.
- The peptide activates AMPK and induces PGC-1α-mediated mitochondrial biogenesis. Both are transcriptional processes that take days to weeks to complete, not acute signaling events.
- Subcutaneous administration delays onset by 1–2 weeks compared to intraperitoneal injection due to depot pharmacokinetics and slower tissue distribution.
- Glucose tolerance improvements appear at 3–4 weeks, insulin sensitivity at 4–6 weeks, and exercise endurance at 4–6 weeks in mouse models using standard 15 mg/kg daily dosing.
- Single-dose MOTS-c studies produce transient effects lasting 12–24 hours; chronic dosing protocols are required to produce durable metabolic remodeling.
- The plasma half-life of MOTS-c in mice is approximately 4.2 hours, necessitating daily or twice-daily administration for sustained tissue exposure.
What If: MOTS-c Research Scenarios
What If Early Timepoint Measurements Show No Effect?
Wait longer before concluding the intervention failed. MOTS-c mechanisms depend on cumulative mitochondrial adaptation. Measuring at 1–2 weeks captures the peptide during transcriptional upregulation but before functional phenotype emerges. Most published studies demonstrating robust MOTS-c efficacy measure primary endpoints at 4 weeks minimum, with secondary analyses extending to 8–12 weeks. If you're running glucose tolerance tests at 7 days and seeing null results, that's mechanistically expected. Extend the treatment window to 28 days and repeat.
What If Results Vary Between Dosing Protocols?
Route and frequency matter as much as total dose. A study administering 15 mg/kg once daily IP will show faster onset than 15 mg/kg once daily subcutaneous because IP produces higher peak plasma concentration and faster tissue distribution. Subcutaneous creates a sustained-release depot that smooths pharmacokinetics but delays peak effect. If you're replicating a published protocol and seeing delayed onset, verify your administration route matches the original study. Route discrepancies explain more timeline variability than dose differences.
What If Aged or Metabolically Compromised Animals Show Slower Response?
Age and baseline metabolic dysfunction extend response timelines by 30–50%. The Cohen Lab's original 2015 Cell Metabolism paper showed that 12-month-old mice (middle-aged equivalent) required 6 weeks to achieve glucose tolerance improvements that 8-week-old mice showed at 4 weeks. The mechanism likely involves slower mitochondrial turnover and reduced PGC-1α responsiveness in aged tissue. If your model uses diet-induced obesity, high-fat feeding duration, or genetic obesity (ob/ob, db/db), add 2 weeks to standard timelines and consider dose escalation.
The Mechanistic Truth About MOTS-c Timeline Delays
Here's the honest answer: researchers expect peptides to work like small-molecule drugs. Dose it, measure an hour later, see an effect. MOTS-c doesn't work that way because it's not a receptor agonist or enzyme inhibitor. It's a signaling molecule that tells cells to build more mitochondria and shift fuel utilization toward fat oxidation. That's a construction project, not a light switch.
The 4–8 week timeline isn't a limitation. It's a feature. Acute metabolic interventions (insulin injections, AMPK activators like AICAR) produce immediate effects that disappear the moment you stop dosing. MOTS-c produces effects that persist for weeks after the final dose because the mitochondrial remodeling it triggered remains even after plasma levels drop to zero. A 2020 follow-up study showed that glucose tolerance improvements persisted for 14 days post-treatment in mice that received 6 weeks of MOTS-c. The peptide reprogrammed metabolism durably, not transiently.
The practical implication: if you're designing a MOTS-c study, plan for minimum 4-week treatment windows and measure primary endpoints at 6–8 weeks. Anything shorter risks false negatives. The peptide works. But only if you give the biology time to execute the program it encodes.
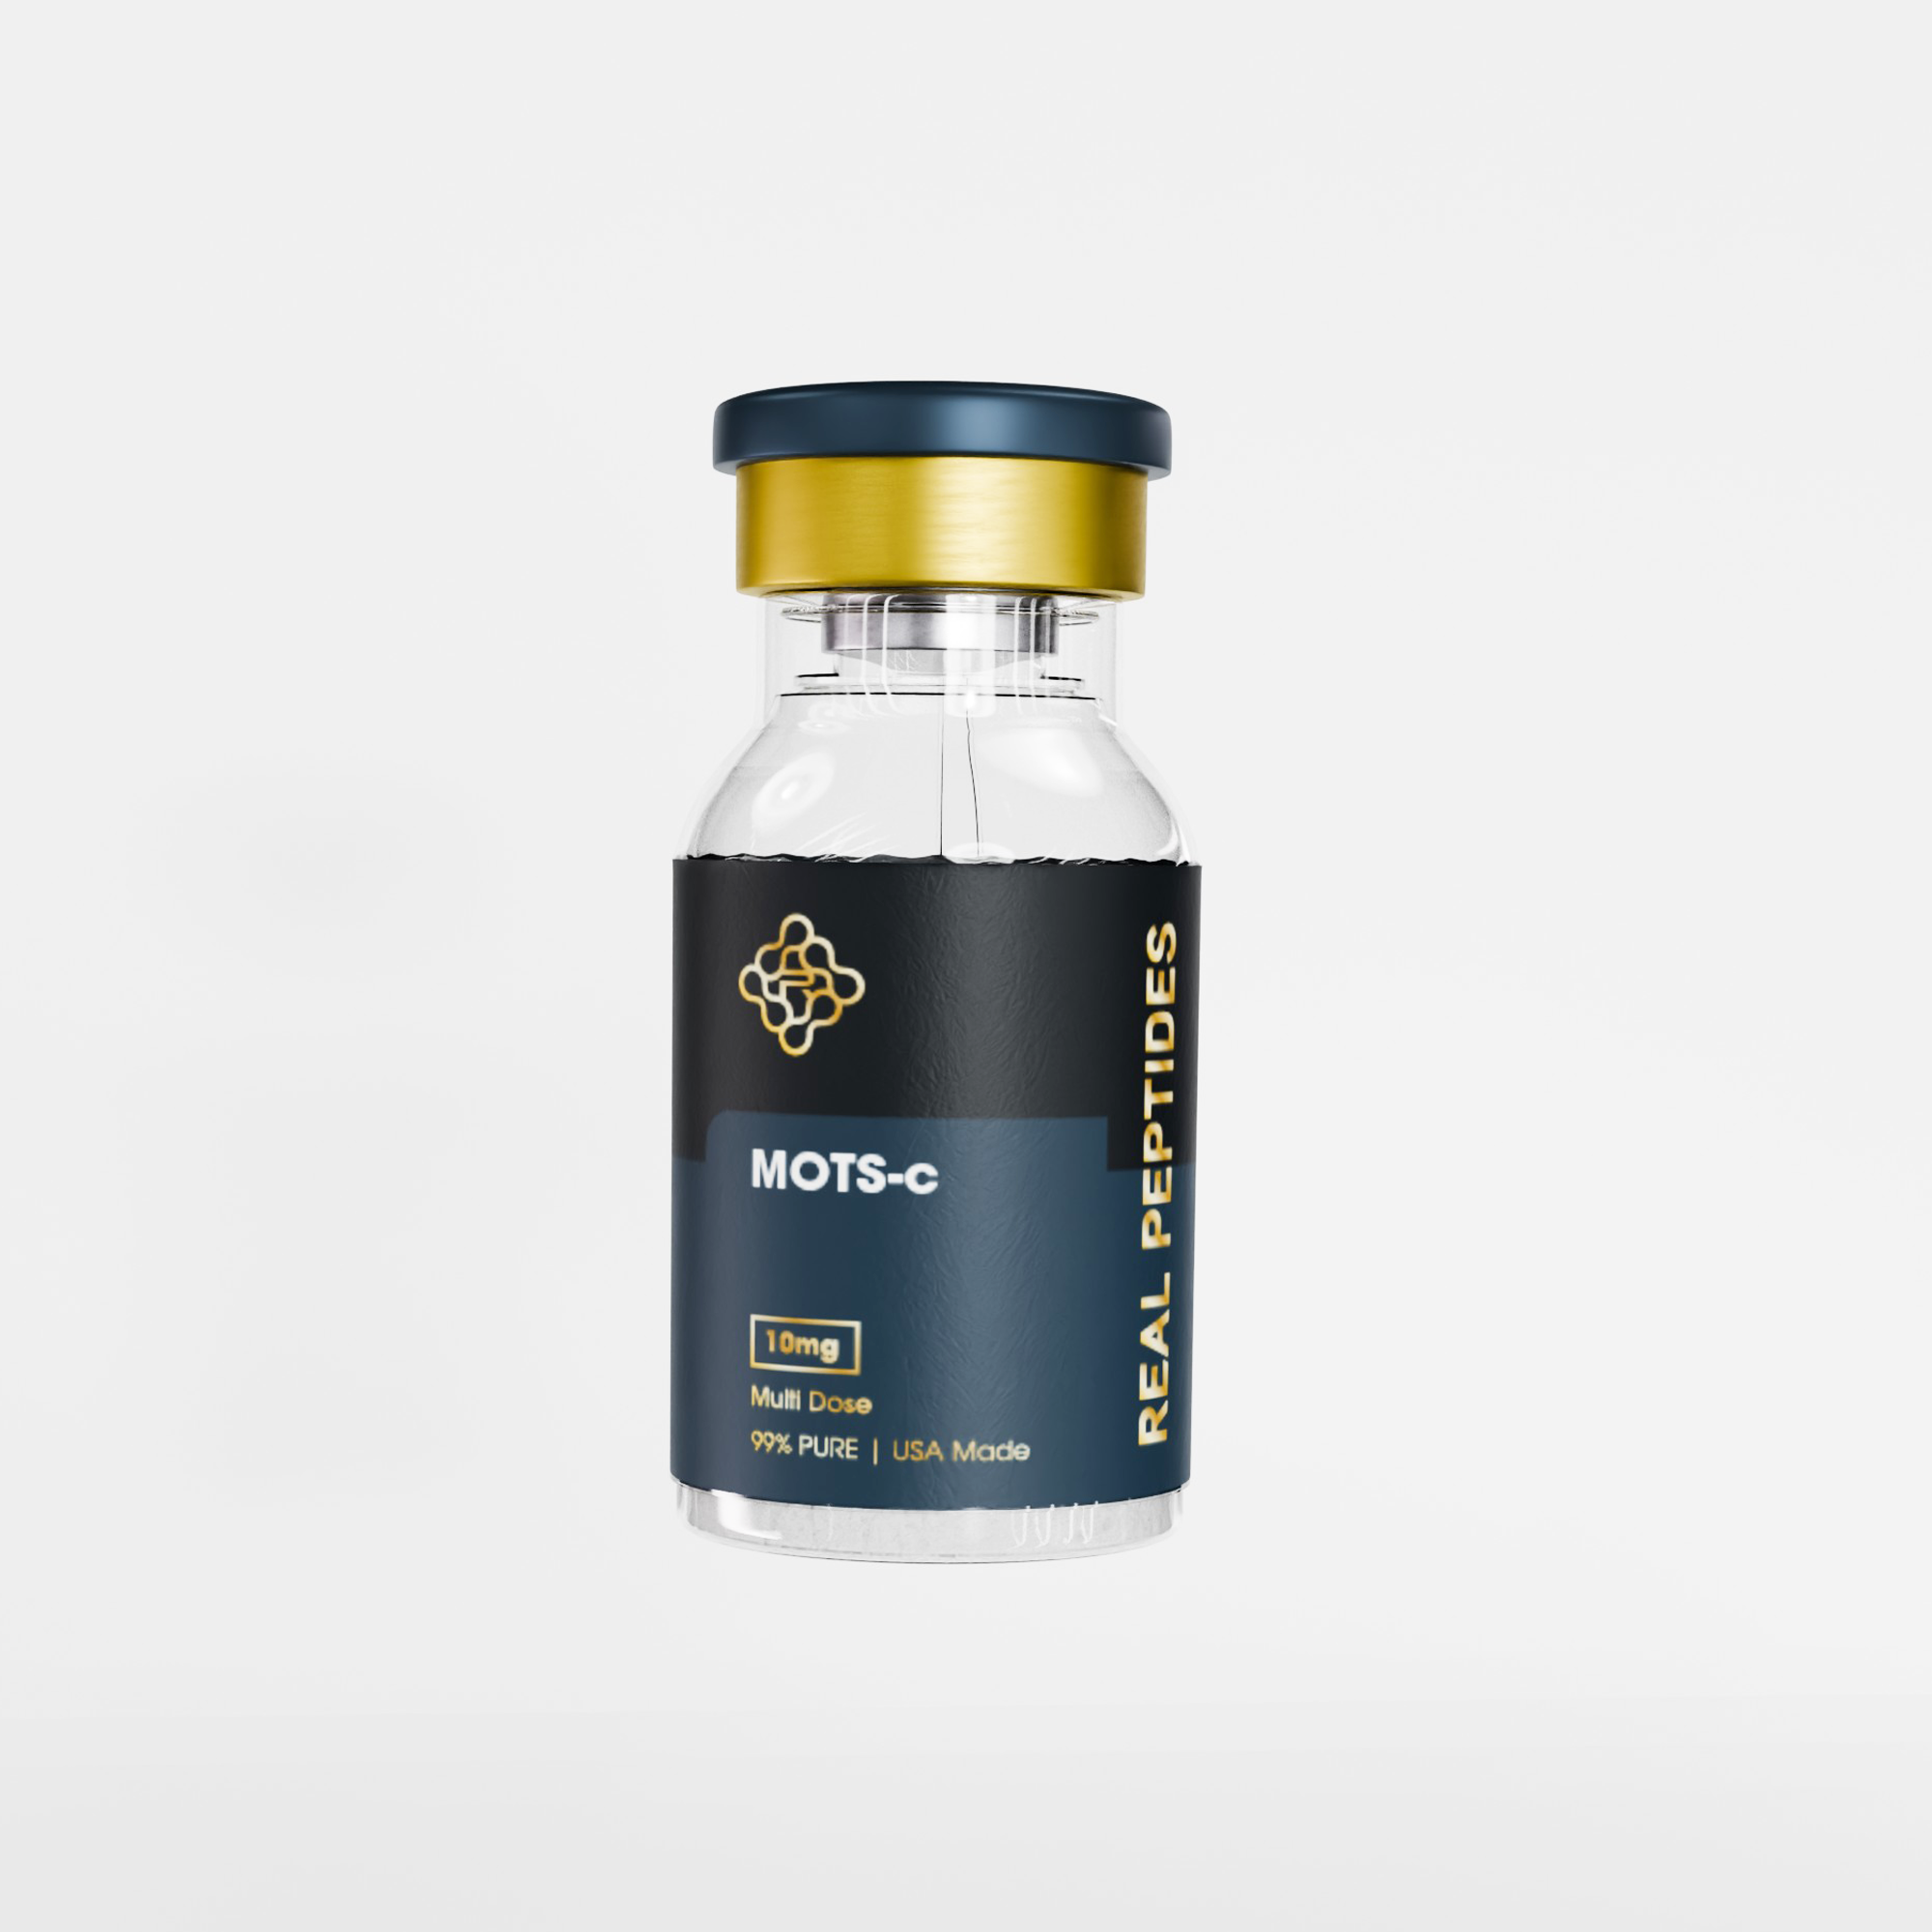
MOTS-c research demands precision at every stage. From peptide purity to dosing consistency to timeline calibration. We've built Real Peptides around that principle: small-batch synthesis with verified amino-acid sequencing, third-party purity testing, and technical support from researchers who understand the biology. If timeline variability is complicating your results, the first variable to eliminate is peptide quality. Degraded or impure formulations won't produce consistent effects regardless of dosing duration. Every batch we ship includes purity documentation and reconstitution protocols calibrated for research-grade stability.
The 4–8 week MOTS-c timeline isn't arbitrary. It's the minimum time required for mitochondrial biogenesis to translate into measurable metabolic phenotype. Plan your experiments accordingly, and the results will follow.
Frequently Asked Questions
How long does MOTS-c take to show effects in cellular assays versus animal models?▼
Cellular assays using isolated mitochondria or cultured muscle cells show MOTS-c effects on ATP production and oxygen consumption within 24–72 hours. Whole-organism outcomes in mice — glucose tolerance, insulin sensitivity, exercise endurance — require 4–8 weeks of sustained daily administration. The discrepancy exists because cellular assays measure direct mitochondrial responses without systemic clearance or tissue remodeling, while animal models require cumulative mitochondrial biogenesis and inter-organ metabolic adaptation to manifest phenotypic changes.
Can single-dose MOTS-c produce measurable research outcomes?▼
Single-dose MOTS-c produces transient metabolic shifts lasting 12–24 hours but does not generate durable research endpoints. Published studies demonstrate that acute dosing increases skeletal muscle glucose uptake for 6–12 hours post-administration, but insulin sensitivity and mitochondrial enzyme activity return to baseline within 48 hours. Chronic dosing protocols (daily administration for 4+ weeks) are required to produce statistically significant metabolic remodeling because MOTS-c’s mechanism depends on sustained AMPK activation driving transcriptional changes, not acute receptor signaling.
What is the optimal treatment duration for MOTS-c glucose tolerance studies?▼
The standard treatment duration for glucose tolerance test (GTT) endpoints in MOTS-c research is 4 weeks minimum, with most published protocols using 4–6 weeks of daily administration. Studies measuring GTT at 1–2 weeks show trending improvements that rarely reach statistical significance because GLUT4 upregulation and hepatic insulin sensitivity shifts require 3–4 weeks of sustained AMPK signaling. If your model uses aged animals or metabolic dysfunction (diet-induced obesity, genetic obesity), extend treatment to 6–8 weeks to account for slower mitochondrial turnover.
Does MOTS-c administration route affect research timeline?▼
Yes, route significantly impacts onset timeline. Intraperitoneal (IP) injection produces faster onset — glucose tolerance improvements at 4 weeks — compared to subcutaneous administration, which requires 6–8 weeks for equivalent effects. IP delivers higher peak plasma concentration and faster tissue distribution, while subcutaneous creates a sustained-release depot with smoother pharmacokinetics but delayed peak effect. Most peer-reviewed MOTS-c studies use IP administration; if replicating published protocols via subcutaneous route, add 2 weeks to reported timelines.
What is the plasma half-life of MOTS-c in research models?▼
MOTS-c has a plasma half-life of approximately 4.2 hours in mice following intravenous bolus administration, as measured in pharmacokinetic studies published in ‘Nature Communications’ (2019). This short half-life necessitates daily or twice-daily dosing to maintain therapeutic tissue levels — single weekly injections do not sustain sufficient plasma concentration to drive the cumulative AMPK activation required for metabolic remodeling. The rapid clearance explains why chronic dosing protocols outperform intermittent high-dose regimens in published efficacy studies.
How long do MOTS-c effects persist after stopping treatment?▼
MOTS-c-induced metabolic improvements persist for 10–14 days post-treatment in mouse models that received 6 weeks of daily administration, according to follow-up studies from the Cohen Lab at USC. Glucose tolerance remained significantly improved 2 weeks after the final dose, suggesting that mitochondrial remodeling and GLUT4 upregulation triggered by MOTS-c outlast the peptide’s plasma presence. This durability distinguishes MOTS-c from acute metabolic interventions like insulin or AMPK activators, which produce effects only during active dosing.
Why do aged animals show delayed MOTS-c response compared to young animals?▼
Aged animals (12+ months in mice) require 6–8 weeks to achieve metabolic improvements that young animals (8–12 weeks) show at 4 weeks because mitochondrial turnover and PGC-1α transcriptional responsiveness decline with age. The original 2015 ‘Cell Metabolism’ study demonstrated this age-dependent delay: middle-aged mice needed 6 weeks of MOTS-c treatment to match the glucose tolerance improvements young mice achieved at 4 weeks. If your research model uses aged or metabolically compromised subjects, extend treatment duration by 2 weeks and consider dose escalation to compensate for reduced mitochondrial plasticity.
What experimental endpoints show the fastest measurable MOTS-c effects?▼
Cellular ATP production and mitochondrial oxygen consumption rate (OCR) show the fastest measurable effects — detectable within 24–72 hours in isolated mitochondrial assays or cultured muscle cells. Whole-organism glucose tolerance improvements emerge at 3–4 weeks, insulin sensitivity at 4–6 weeks, and exercise endurance at 4–6 weeks. If rapid proof-of-concept data is required, use in vitro assays measuring OCR or glucose uptake in primary myotubes; these capture direct AMPK activation without requiring systemic metabolic adaptation.
Does MOTS-c dosing frequency affect research timeline more than total dose?▼
Yes, frequency matters more than total dose for timeline outcomes. A study administering 15 mg/kg daily shows faster onset than 50 mg/kg twice weekly, even though weekly total dose is higher in the latter protocol. MOTS-c’s 4.2-hour half-life means that infrequent high-dose regimens produce peak-and-trough plasma profiles that fail to sustain the continuous AMPK activation required for transcriptional remodeling. Daily or twice-daily dosing maintains therapeutic tissue exposure throughout the treatment window, accelerating mitochondrial biogenesis and shortening time to measurable endpoints by 1–2 weeks compared to intermittent protocols.
What confounds early-timepoint MOTS-c measurements in metabolic research?▼
The primary confound is measuring functional metabolic outcomes (glucose tolerance, insulin sensitivity, endurance) before transcriptional remodeling completes. MOTS-c activates AMPK within hours, but downstream effects — GLUT4 expression, mitochondrial enzyme upregulation, PGC-1α-driven biogenesis — take 7–14 days to manifest at the protein level. Measuring GTT or ITT at 1 week captures the peptide mid-mechanism, producing null or weak results that don’t reflect true efficacy. Secondary confounds include route variation (IP vs subcutaneous), baseline metabolic state (lean vs obese models), and age-related differences in mitochondrial plasticity.