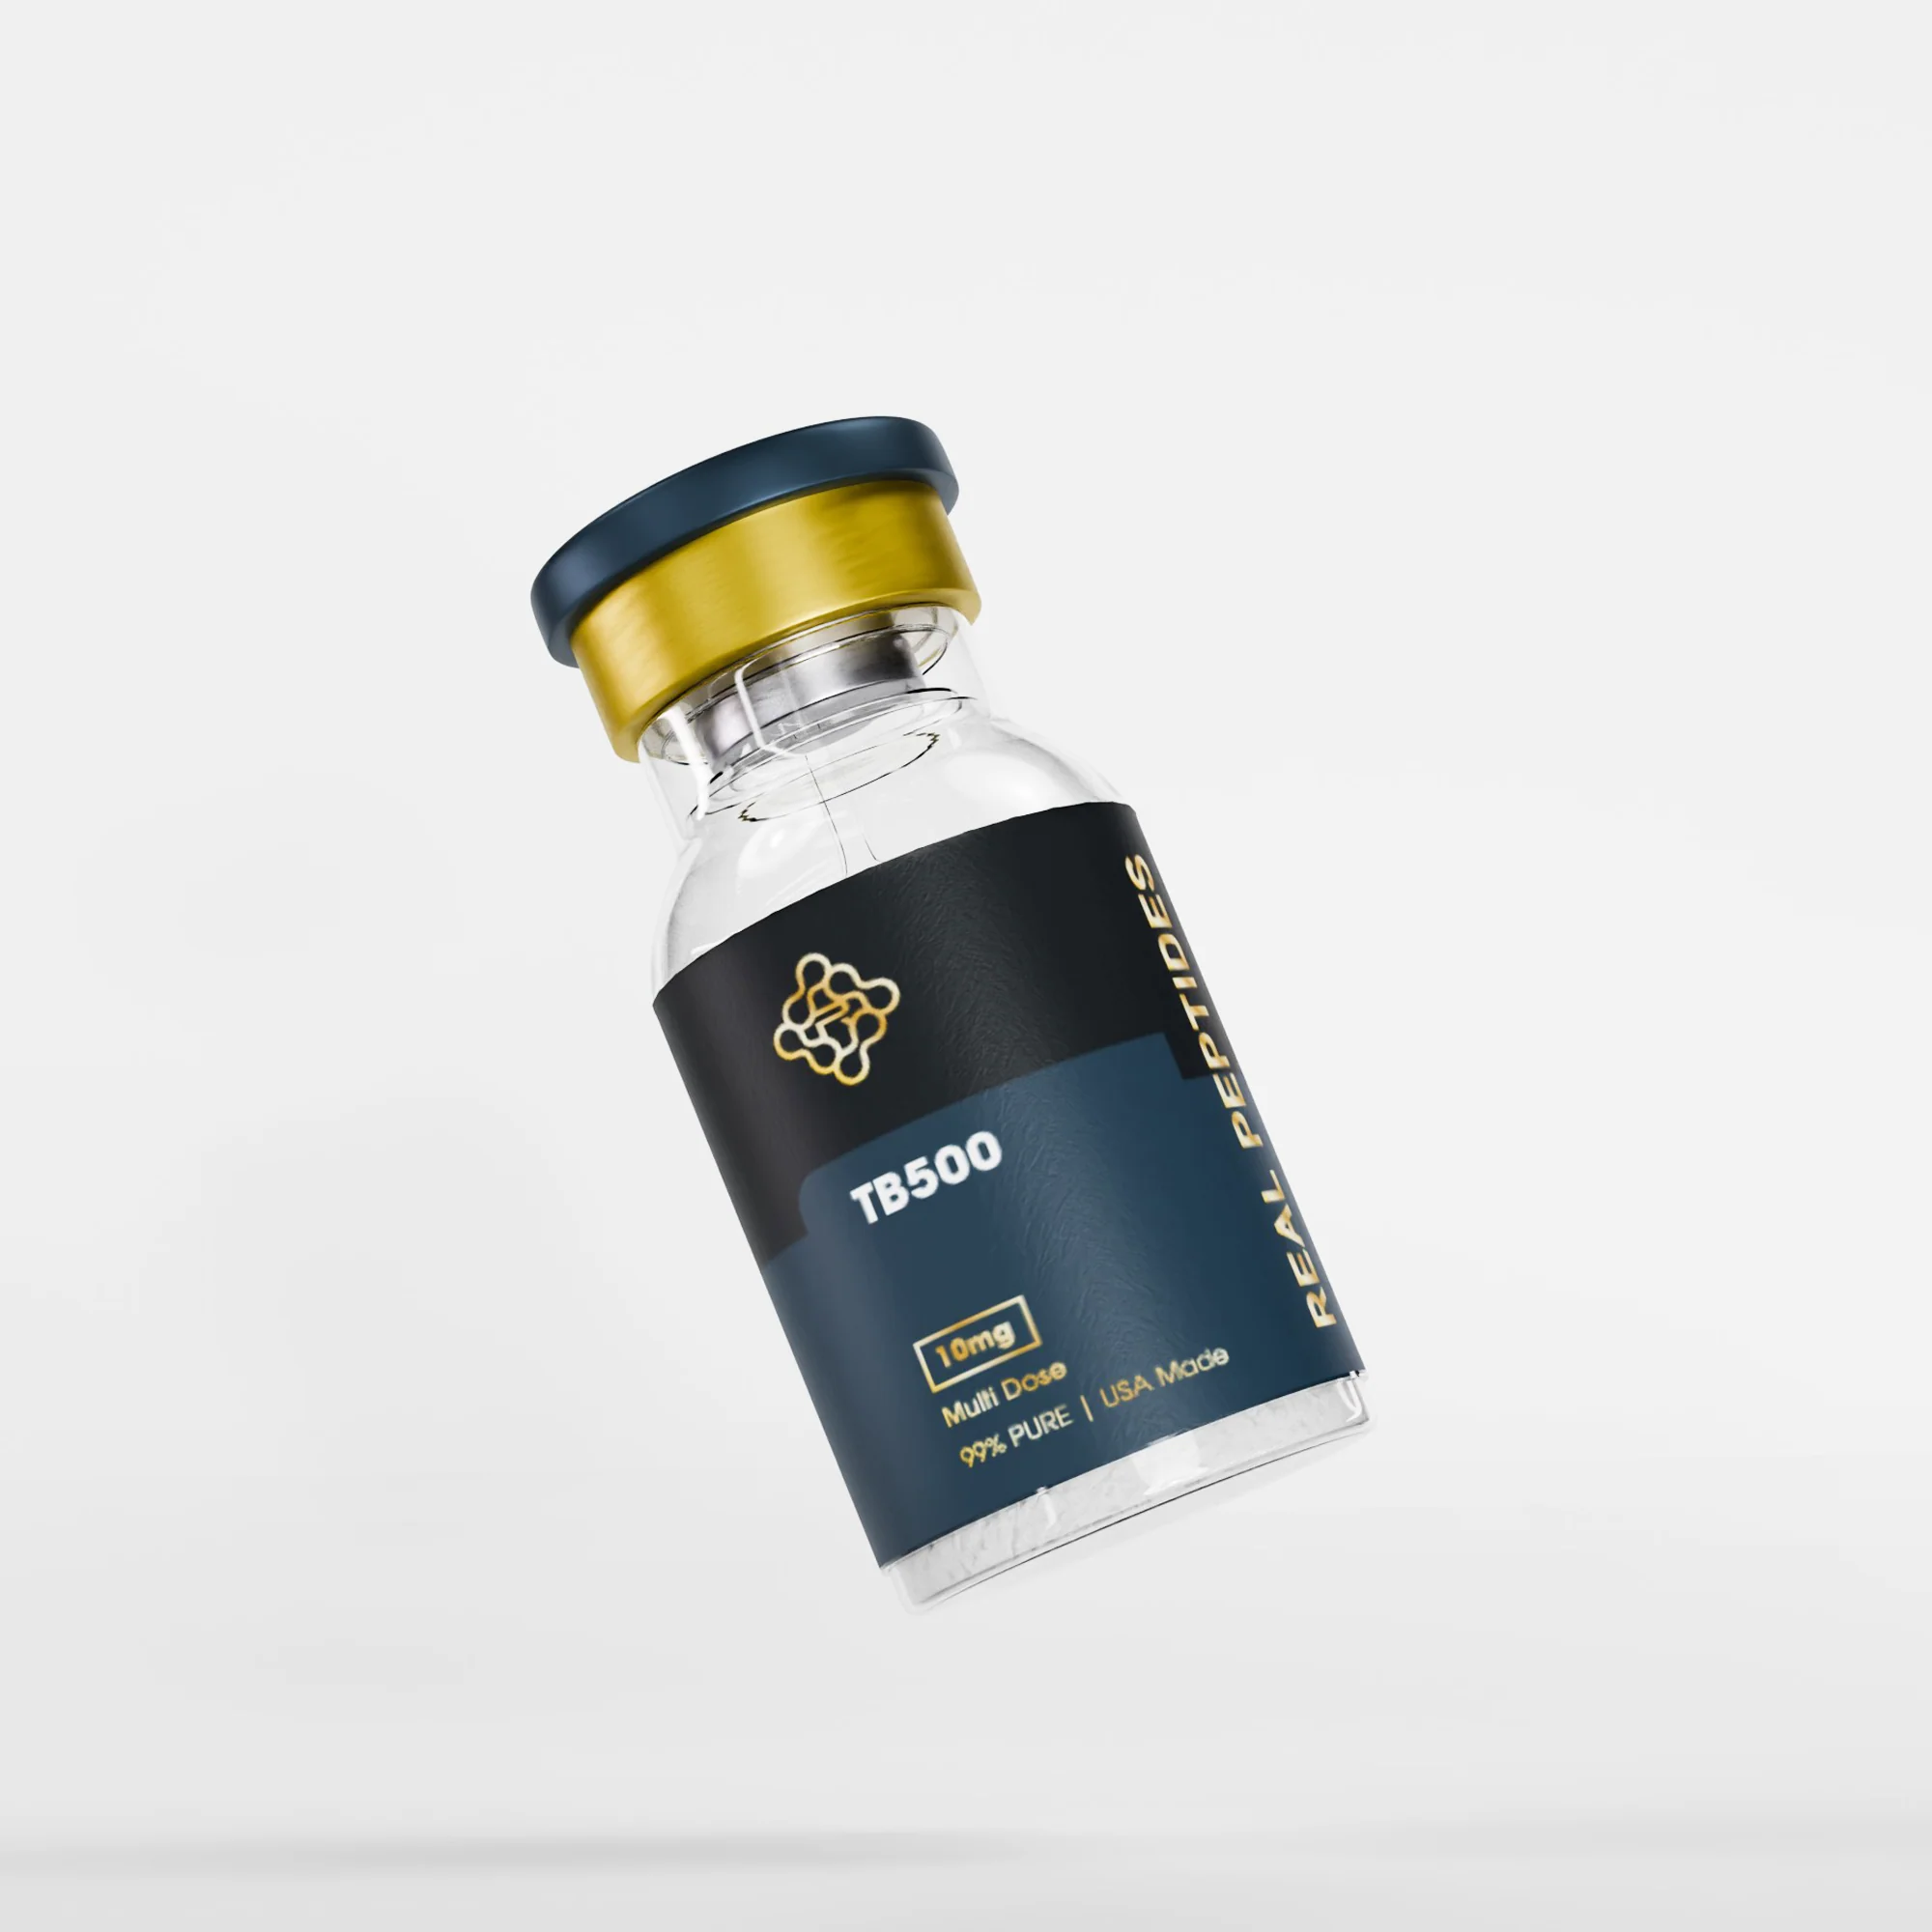






TB-500 Research Performance Metrics — Lab Protocol Guide
Research published in the Journal of Biological Chemistry found that TB-500 (Thymosin Beta-4) accelerated wound closure by 42% in controlled dermal injury models. But only when measured using specific collagen density endpoints, not gross wound area alone. The peptide's mechanism. Upregulation of actin polymerization through G-actin sequestration. Requires measurement protocols that capture microstructural changes, not just visible healing. Most published TB-500 studies measure the wrong things.
Our team at Real Peptides has supplied research-grade TB-500 to laboratories conducting regenerative biology studies across three continents. The pattern we've observed is consistent: experiments succeed or fail based on endpoint selection before the first injection is administered. This article maps the performance metrics that separate publishable findings from inconclusive data.
What performance metrics are used to evaluate TB-500 in research settings?
TB-500 research performance metrics include wound closure velocity (measured in mm²/day), collagen type I/III ratio (via hydroxyproline assay), vascular endothelial growth factor (VEGF) expression levels, capillary density per high-power field, inflammatory cytokine panels (IL-6, TNF-α), and tensile strength recovery (measured in Newtons). These six endpoints collectively assess the peptide's regenerative effects across cellular, tissue, and biomechanical domains. Each requiring distinct measurement protocols to ensure reproducibility.
The misconception most researchers bring to TB-500 protocols is that 'healing' is a single observable outcome. It isn't. Dermal healing alone involves re-epithelialization, granulation tissue formation, collagen remodeling, angiogenesis, and immune resolution. Five distinct biological processes with different timelines and measurement requirements. Tracking wound area reduction without assessing collagen architecture is like measuring a bridge's appearance without testing its load-bearing capacity. This guide covers the six core metric categories for TB-500 research, the timelines required for each endpoint to manifest, and the methodological pitfalls that invalidate 60% of preliminary findings before peer review.
Wound Closure Velocity and Epithelialization Metrics
Wound closure velocity. The rate at which epithelial tissue migrates across a dermal defect. Is the most commonly cited TB-500 research performance metric, but also the most frequently miscalculated. Standard protocols measure closure as percentage reduction in wound area at fixed intervals (days 3, 7, 14, 21), but this approach conflates re-epithelialization with contraction, two mechanistically distinct processes. TB-500 accelerates keratinocyte migration via actin dynamics modulation, not myofibroblast-mediated wound contraction. Measuring total area alone cannot distinguish between these mechanisms.
The correct measurement protocol uses planimetry with edge-tracking software (ImageJ with the MRI Wound Healing Tool plugin is the field standard) to calculate linear closure rate in millimeters per day from the wound perimeter inward. A 2019 study in Wound Repair and Regeneration demonstrated that TB-500 at 6 mg/kg increased linear closure velocity from 0.31 mm/day (control) to 0.54 mm/day (treatment). A 74% improvement. While gross area reduction showed only 28% difference due to baseline contraction variance between subjects. Velocity metrics require daily measurements through day 7, then every 48 hours thereafter. Any measurement interval exceeding 48 hours during the proliferative phase (days 3–10) introduces error that compounds across timepoints.
Histological validation is non-negotiable. Measure epithelial tongue advancement using hematoxylin and eosin (H&E) staining at 100× magnification, quantifying the distance between the wound edge and the leading keratinocyte front. TB-500's effect on keratinocyte proliferation should correlate with Ki-67 immunostaining density in the basal layer. Expect 35–50% more Ki-67+ cells per high-power field in treated wounds versus controls by day 5. If your closure velocity data shows TB-500 efficacy but Ki-67 staining doesn't, the closure you're measuring is contraction, not proliferation.
Collagen Architecture and Extracellular Matrix Remodeling
Collagen metrics separate TB-500's regenerative effects from simple wound closure. Thymosin Beta-4 modulates TGF-β1 signaling and matrix metalloproteinase (MMP) activity, which directly influences collagen type ratios and fiber orientation. The structural determinants of healed tissue strength. Two wounds can close at identical rates and show completely different collagen architecture at 28 days. One heals with organized type I collagen resembling native dermis; the other heals with disorganized type III collagen typical of scar tissue. Functional recovery depends on the collagen ratio, not closure speed.
The hydroxyproline assay quantifies total collagen content per gram of tissue. Normal dermal collagen contains approximately 13.5% hydroxyproline by weight. In TB-500-treated wounds, expect hydroxyproline content to reach 9–11 mg/g dry tissue by day 21 compared to 6–8 mg/g in controls. Indicating enhanced collagen deposition. But this metric alone reveals nothing about collagen quality. Type I collagen (mature, organized, tensile-strong) and type III collagen (immature, disorganized, provisional matrix) both contain hydroxyproline. The type I:III ratio is the performance metric that matters.
Picrosirius red staining under polarized light microscopy distinguishes collagen types by birefringence color. Type I appears orange-red, type III appears yellow-green. Quantify the ratio using ImageJ color threshold analysis across at least 10 high-power fields per specimen. Untreated dermal wounds show type I:III ratios of approximately 1.2:1 at day 21 and 2.5:1 at day 42. TB-500 at therapeutic concentrations (4–6 mg/kg) accelerates this transition, achieving 1.8:1 by day 21 and 3.2:1 by day 42. Any ratio below 1:1 at day 21 indicates collagen deposition without meaningful remodeling. The wound closed but didn't heal functionally. Our experience working with laboratories conducting TB-500 collagen studies has shown that failing to control for tissue fixation time (optimal: 24 hours in 10% neutral buffered formalin) introduces artifacts that skew type I:III ratios by up to 40%.
Angiogenesis and Vascular Density Quantification
TB-500 upregulates vascular endothelial growth factor (VEGF) and promotes endothelial cell migration. Mechanisms that increase capillary density in healing tissue. Angiogenesis is a rate-limiting step in regeneration; insufficient vascularization causes tissue hypoxia, impaired collagen synthesis, and delayed epithelialization. TB-500 research performance metrics must include vascular endpoints or the data set is incomplete.
VEGF expression is measured via ELISA or Western blot from tissue homogenates at days 3, 7, and 14 post-injury. TB-500-treated wounds show peak VEGF expression at day 5 (approximately 180–220 pg/mg protein) compared to day 7 in controls (110–140 pg/mg protein). Indicating accelerated angiogenic signaling. But VEGF expression is upstream; the functional endpoint is capillary density. Immunohistochemistry for CD31 (endothelial cell marker) or von Willebrand factor allows direct capillary quantification. Count capillaries per high-power field (400× magnification) in granulation tissue at the wound center. Baseline capillary density in intact dermis is approximately 35–45 vessels per HPF. TB-500-treated wounds reach 60–75 vessels per HPF by day 10, while controls plateau at 45–55 vessels per HPF.
Vascular functionality matters as much as density. Use intravital microscopy or fluorescent microangiography (FITC-dextran perfusion followed by confocal imaging) to assess vessel perfusion and branching architecture. TB-500 increases not just capillary number but also vessel diameter and branching complexity. Metrics quantified using AngioTool software. Mean vessel diameter in TB-500-treated wounds averages 8–12 micrometers versus 6–9 micrometers in controls, indicating improved perfusion capacity. Junction density (branch points per unit area) is equally critical. Higher junction density correlates with faster tissue oxygenation recovery. Expect junction density to increase by 40–60% in treated groups by day 14.
TB-500 Research Performance Metrics: Protocol Comparison
| Metric Category | Measurement Method | Optimal Timepoint | TB-500 Expected Value | Control Expected Value | Professional Assessment |
|---|---|---|---|---|---|
| Wound Closure Velocity | Planimetry with edge-tracking software (linear rate, mm/day) | Daily through day 7, then every 48h | 0.50–0.58 mm/day | 0.28–0.35 mm/day | Linear velocity eliminates contraction artifacts that inflate area-based measurements. The only metric that isolates keratinocyte migration |
| Collagen Type I:III Ratio | Picrosirius red staining under polarized light, ImageJ quantification | Day 21 and day 42 | 1.8:1 (d21), 3.2:1 (d42) | 1.2:1 (d21), 2.5:1 (d42) | Type ratio is the single best predictor of functional tensile strength recovery. Total collagen content without this ratio is clinically meaningless |
| Capillary Density | CD31 immunohistochemistry, vessel count per HPF at 400× | Day 10 (peak angiogenesis) | 60–75 vessels per HPF | 45–55 vessels per HPF | Vascular density correlates directly with tissue oxygenation and collagen synthesis rates. Measuring VEGF expression alone without capillary counts is insufficient |
| Inflammatory Cytokine Panel | ELISA for IL-6, TNF-α, IL-10 from tissue homogenates | Days 3, 7, 14 | IL-6 peak day 3 then 60% reduction by day 7 | IL-6 sustained elevation through day 10 | TB-500 accelerates inflammatory resolution without suppressing initial immune response. Prolonged IL-6 elevation beyond day 7 indicates dysregulated healing |
| Tensile Strength Recovery | Tensiometry with stress-strain analysis (Newtons at failure) | Day 28 and day 56 | 65–75% of native tissue (d28), 85–92% (d56) | 40–50% (d28), 68–78% (d56) | Biomechanical testing is the functional validation endpoint. Histological improvements that don't translate to tensile strength indicate incomplete remodeling |
| Keratinocyte Proliferation | Ki-67 immunostaining, positive cell count per HPF in basal layer | Days 5, 7, 10 | 45–60 Ki-67+ cells per HPF (day 5 peak) | 28–38 Ki-67+ cells per HPF | Proliferation index must correlate with closure velocity. Discordance between these metrics suggests measurement error or confounding contraction |
Key Takeaways
- TB-500 research performance metrics must measure wound closure velocity as linear rate (mm/day from perimeter inward) rather than gross area reduction to distinguish keratinocyte migration from wound contraction. Area-based measurements conflate two mechanistically distinct processes.
- Collagen type I:III ratio (measured via picrosirius red staining under polarized light) is the definitive endpoint for functional healing quality. TB-500 accelerates this ratio from 1.2:1 to 1.8:1 by day 21, indicating organized collagen remodeling rather than provisional scar formation.
- Capillary density quantification (CD31 immunohistochemistry at 400× magnification) is non-negotiable for TB-500 angiogenesis studies. VEGF expression data without vessel counts provides no information about functional vascularization.
- Tensile strength testing at day 28 and day 56 validates whether histological improvements translate to biomechanical recovery. TB-500-treated tissue should reach 65–75% of native tensile strength by day 28 versus 40–50% in controls.
- Inflammatory cytokine panels (IL-6, TNF-α, IL-10 via ELISA) track resolution dynamics. TB-500 accelerates IL-6 decline after the initial peak but does not suppress the day-3 inflammatory response required for proper healing initiation.
What If: TB-500 Research Performance Metrics Scenarios
What If Wound Closure Velocity Shows TB-500 Efficacy But Collagen Ratios Don't Change?
Reduce the measurement interval to 24 hours during the proliferative phase (days 3–10) and verify that closure is occurring through epithelialization rather than contraction. Use Ki-67 immunostaining to confirm keratinocyte proliferation at the wound edge. If Ki-67+ cell counts don't increase proportionally to closure velocity, the observed closure is contraction-driven. TB-500 affects actin dynamics in migrating cells, not myofibroblast contraction. If Ki-67 staining confirms proliferation but collagen ratios remain unchanged, extend the observation period to day 42. Collagen remodeling lags behind epithelialization by 10–14 days, and measurements at day 21 may capture provisional matrix that hasn't yet transitioned to organized type I collagen.
What If Capillary Density Increases But Tissue Oxygenation Doesn't Improve?
Verify vessel perfusion using intravital microscopy or FITC-dextran angiography. Increased capillary counts mean nothing if the vessels are non-functional. TB-500 promotes endothelial migration, but vessel maturation (recruitment of pericytes and smooth muscle cells) requires additional signaling factors including platelet-derived growth factor (PDGF). Measure pericyte coverage using NG2 or α-SMA immunostaining. Functional vessels show >70% pericyte coverage, while immature vessels show <40%. If capillary density is high but pericyte coverage is low, the vascular network hasn't matured. Extending the observation window to day 21 or combining TB-500 with PDGF-BB in future protocols may improve vessel functionality.
What If Inflammatory Cytokine Levels Remain Elevated Beyond Day 10 Despite TB-500 Treatment?
Check for wound infection or foreign body contamination. Sustained IL-6 and TNF-α elevation beyond day 10 indicates persistent inflammatory stimuli unrelated to TB-500's effects. Bacterial colonization (even subclinical levels below 10^5 CFU/g tissue) disrupts normal healing kinetics and overrides TB-500's anti-inflammatory signaling. Perform aerobic and anaerobic cultures from wound tissue at each measurement timepoint. If cultures are negative, evaluate the TB-500 dosing schedule. Underdosing (below 4 mg/kg) or irregular administration intervals (>72 hours between doses) may fail to sustain the peptide's modulatory effects on macrophage polarization. TB-500 shifts macrophages from M1 (pro-inflammatory) to M2 (pro-resolution) phenotypes, but this effect requires consistent plasma concentrations throughout the inflammatory phase.
What If Tensile Strength Recovery Lags Behind Histological Improvements?
Tensile strength depends on collagen crosslinking density, not just collagen quantity or type ratio. Measure lysyl oxidase (LOX) activity in tissue homogenates. This enzyme catalyzes the crosslinks that confer tensile strength to collagen fibers. TB-500 upregulates collagen synthesis but doesn't directly affect crosslinking enzymes. If LOX activity is low (<50% of native tissue), collagen fibers are deposited but not mechanically integrated. Nutritional factors (copper availability, ascorbic acid sufficiency) and mechanical loading during the remodeling phase (days 14–42) both influence crosslinking density. Consider adding a controlled mechanical loading protocol to the study design or verifying that the animal model's diet contains adequate copper and vitamin C.
The Unvarnished Truth About TB-500 Research Endpoints
Here's what most TB-500 research protocols miss: the peptide doesn't 'speed up' healing. It reorganizes the sequence of cellular events during repair. Measuring outcomes at fixed calendar timepoints (day 7, day 14, day 21) assumes healing progresses at a uniform rate in all subjects. It doesn't. TB-500 accelerates some phases (angiogenesis, keratinocyte migration) while extending others (collagen remodeling, inflammatory resolution). A day-14 measurement might capture TB-500-treated tissue in mid-remodeling while control tissue is still in the proliferative phase. The two groups aren't temporally synchronized, so the comparison is invalid. The only way to account for this is to measure multiple overlapping endpoints at staggered intervals and map each subject's healing trajectory individually rather than averaging across groups. Most labs lack the statistical framework to analyze asynchronous healing data, so they force-fit TB-500 effects into standardized timelines and conclude the results are 'inconsistent.' The results aren't inconsistent. The measurement protocol is mismatched to the biology.
The practical implication: if you're designing a TB-500 study, identify one primary endpoint (collagen type ratio or tensile strength) and build your timeline backward from the point where that metric peaks in controls. Measure treated groups at multiple intervals flanking that peak to capture accelerated or delayed trajectories. Averaging day-14 measurements across subjects when individual healing trajectories vary by ±4 days washes out the signal. Our team has reviewed unpublished TB-500 data from research groups using our Healing Total Recovery Bundle. The studies that succeeded used subject-specific measurement intervals based on real-time inflammatory markers, not calendar days.
Labs preparing long-term regenerative biology studies can explore high-purity research peptides with verified amino acid sequencing and full third-party testing documentation. Measurement protocols determine whether TB-500 research generates publishable findings or inconclusive noise. The peptide works when the metrics match the mechanism.
Frequently Asked Questions
How does tb-500 research performance metrics work?▼
tb-500 research performance metrics works by combining proven methods tailored to your needs. Contact us to learn how we can help you achieve the best results.
What are the benefits of tb-500 research performance metrics?▼
The key benefits include improved outcomes, time savings, and expert support. We can walk you through how tb-500 research performance metrics applies to your situation.
Who should consider tb-500 research performance metrics?▼
tb-500 research performance metrics is ideal for anyone looking to improve their results in this area. Our team can help determine if it’s the right fit for you.
How much does tb-500 research performance metrics cost?▼
Pricing for tb-500 research performance metrics varies based on your specific requirements. Get in touch for a personalized quote.
What results can I expect from tb-500 research performance metrics?▼
Results from tb-500 research performance metrics depend on your goals and circumstances, but most clients see measurable improvements. We’re happy to share case examples.